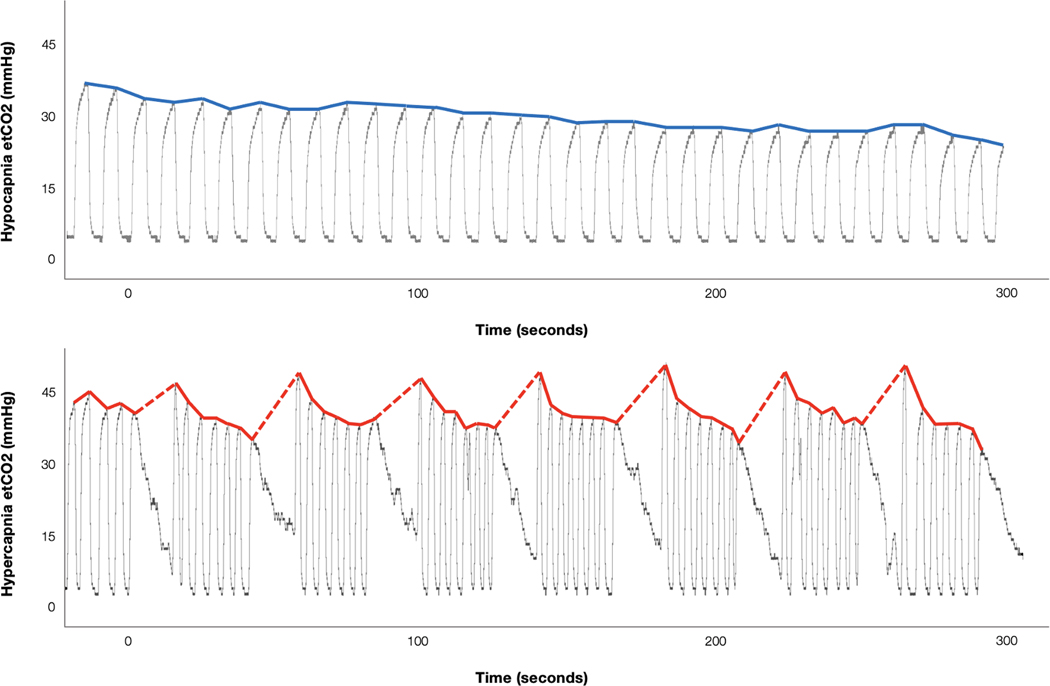
Fig. 2.
Representative end-tidal CO2 (etCO2) timeseries data across the duration of pseudo-continuous arterial spin labeling (pCASL) scans for 0.1Hz paced breathing (top) and breath hold (bottom) conditions. Raw capnography recordings of etCO2 are shown as gray traces. Extracted etCO2 values are shown in bold colored lines. Top (blue): EtCO2 levels are gradually decreasing during 0.1Hz paced breathing (hypocapnia). Bottom (red): Dashed lines indicate breath holds. The exhale immediately following each breath hold shows an increase in etCO2 (hypercapnia).

