Figure 3.

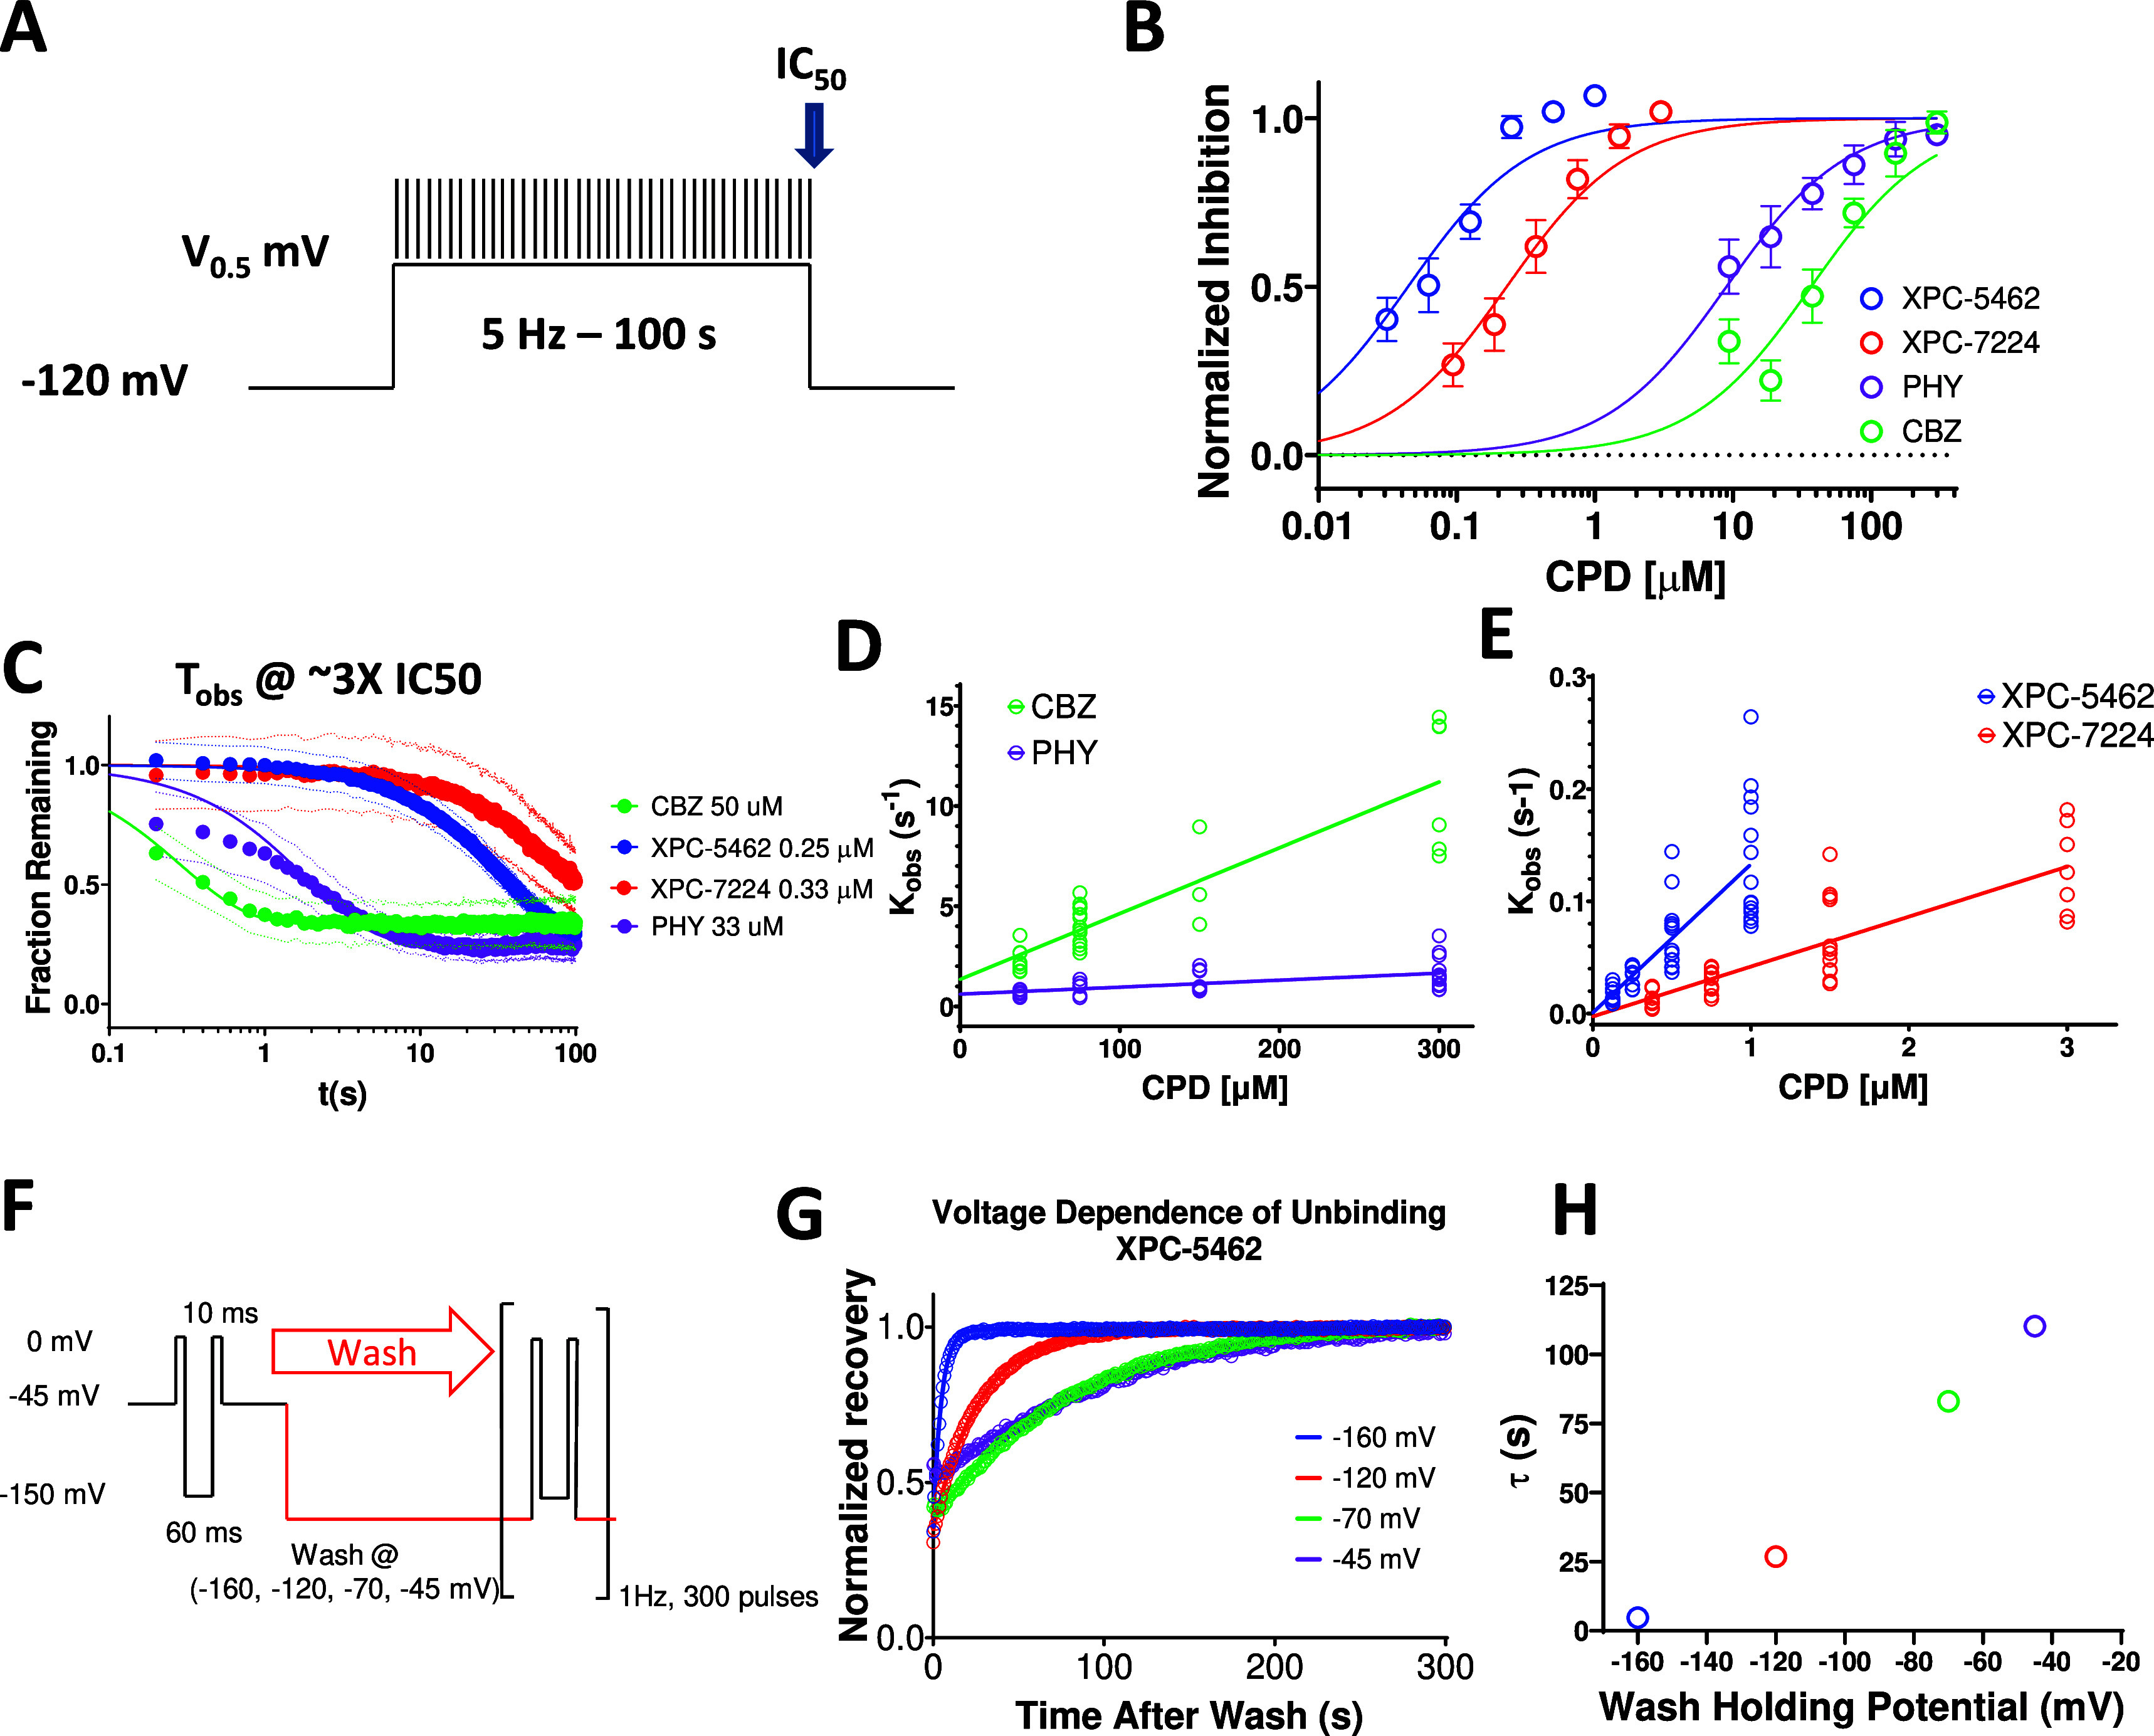
VSD-IV-binding XPC compounds display slower kinetics than typical pore binding ASMs. (A) Protocol used to establish kinetics of compound equilibration at a V0.5 holding potential where voltage is stepped to the V0.5 for 100 s while applying a test pulse at 5 Hz to assess the rate of inhibition. (B) Plot of normalized concentration response fit with the Hill equation to calculate IC50 values for NaV1.6 inhibition for XPC-5462 (n = 7 cells), XPC-7224 (n = 3 cells), PHY (n = 4 cells), and CBZ (n = 3 cells). (C) Normalized equilibration rates of compounds at approximately 3× the IC50 concentrations, dots represent 95% CI (n = 3–7 cells per compound). (D, E) Plot of Kobs against concentration fit with an equation for a straight line to give kon for CBZ (n = 3–13 cells per concentration), PHY (n = 7–14 cells per concentration), XPC-7724 (n = 7–12 cells per concentration), and XPC-5462 (n = 8–15 cells per concentration). (F) Protocol used to assess the voltage dependence of the unbinding rate in which the compound is equilibrated with the CPD in the inactivated state at −45 mV before simultaneously washing the CPD while stepping the voltage. (G) Plot of normalized fractional recovery against time for different holding voltages fit with single exponential functions. (H) Time constants of the recovery rate plotted against membrane voltage during the wash.
