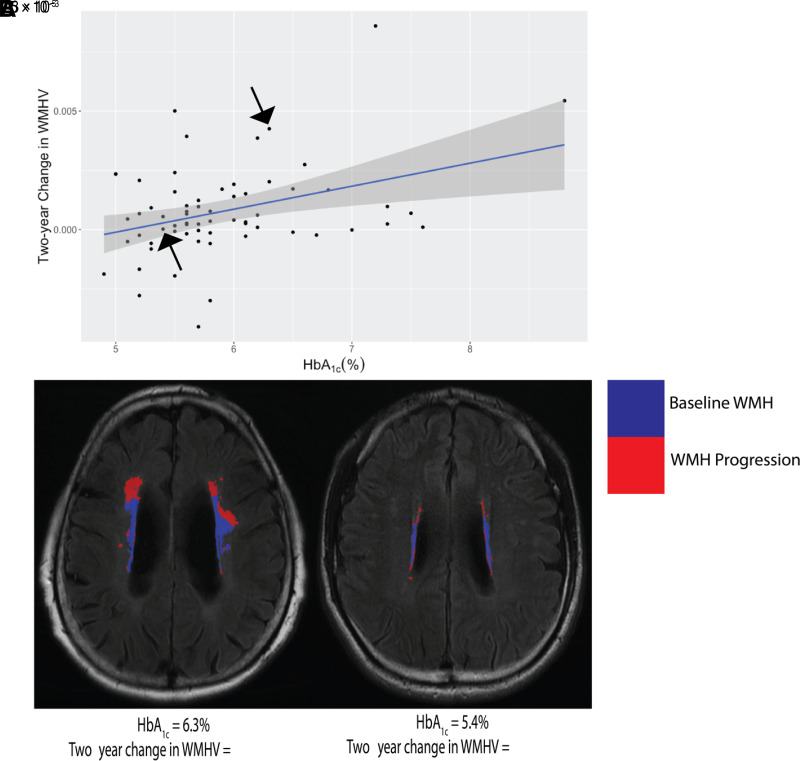
Figure 1.
A: HbA1c is significantly associated with 2-year WMHV progression. The two black arrows represent the two participants shown in (B). B: MRI scans of two individual participants. WMH from the first scan was registered and overlayed with the second scan and its WMH to display the WMH progression over 2 years. One participant had high HbA1c, WMHV, and WMHV change; and the other had low HbA1c, WMHV, and WMHV change. Shaded area represents the 95% CI.

