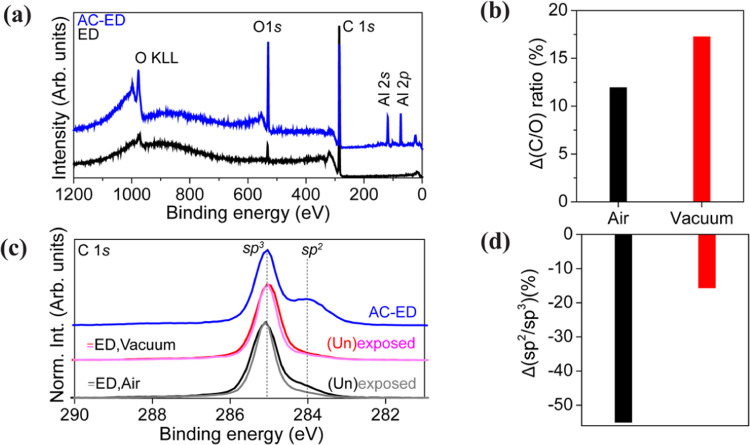
Figure 5.
Surface spectroscopy (a) XPS survey spectra of ED and AC-ED samples before laser exposure. (b) Changes in the total carbon-to-oxygen (C/O) ratio of the ED sample as a result of laser exposure, in different environments. (c) C 1s core level spectra showing results from regions in ED exposed to laser (pink, gray), as well as unexposed regions (black, red). The spectra are normalized to the maximum peak height. (d) Changes in the sp2/sp3 carbon ratio of the ED sample as a result of laser exposure in different environments.

