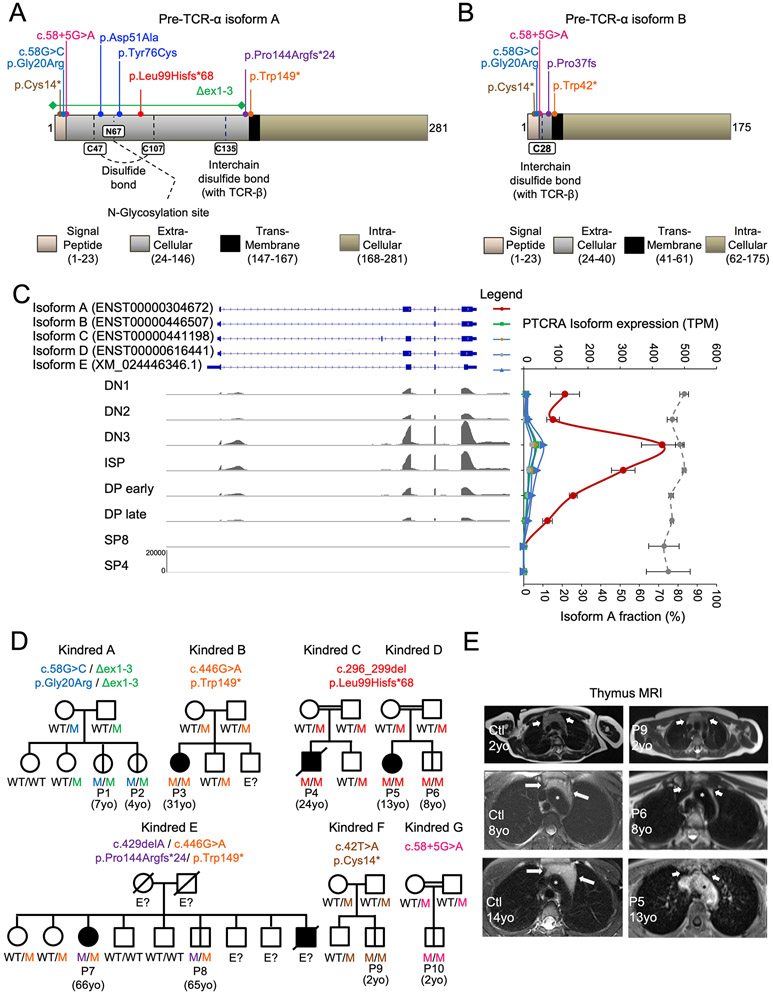
Fig. 1. Autosomal recessive pre-TCRα deficiency.
(A to B) Schematic representations of the isoform A (A) and B (B) proteins encoded by PTCRA. (C) Abundance of the indicated pre-TCRα isoforms in transcripts per million (TPM) across thymocyte developmental stages (DN1, DN2, DN3, ISP, DP early, DP late, and single-positive SP8 and SP4). The proportion of total PTCRA transcripts corresponding to isoform A in each thymocyte subset is indicated on the graph (dashed gray line). (D) Pedigree of the seven unrelated families displaying familial segregation of the mutant PTCRA alleles. The indicated mutant alleles, each with a unique color code, are labeled “M" in the pedigree. Individuals of unknown genotype are labeled “E?”. Asymptomatic individuals are annotated with a vertical bar. (E) MRI on axial sections at the level of the aortic arch: T1-weighted sequences after gadolinium injection (P5) and T2-weighted sequences (P6, P9, and controls), for P5, P6, P9, and age- and sex-matched controls. In patients, the thymic lodge, located between the sternum and the aortic arch (asterisk), appears empty (P5 and P6) or small (P9). By contrast, the thymus is clearly visible in controls, even after the onset of puberty (14-year-old girl).

