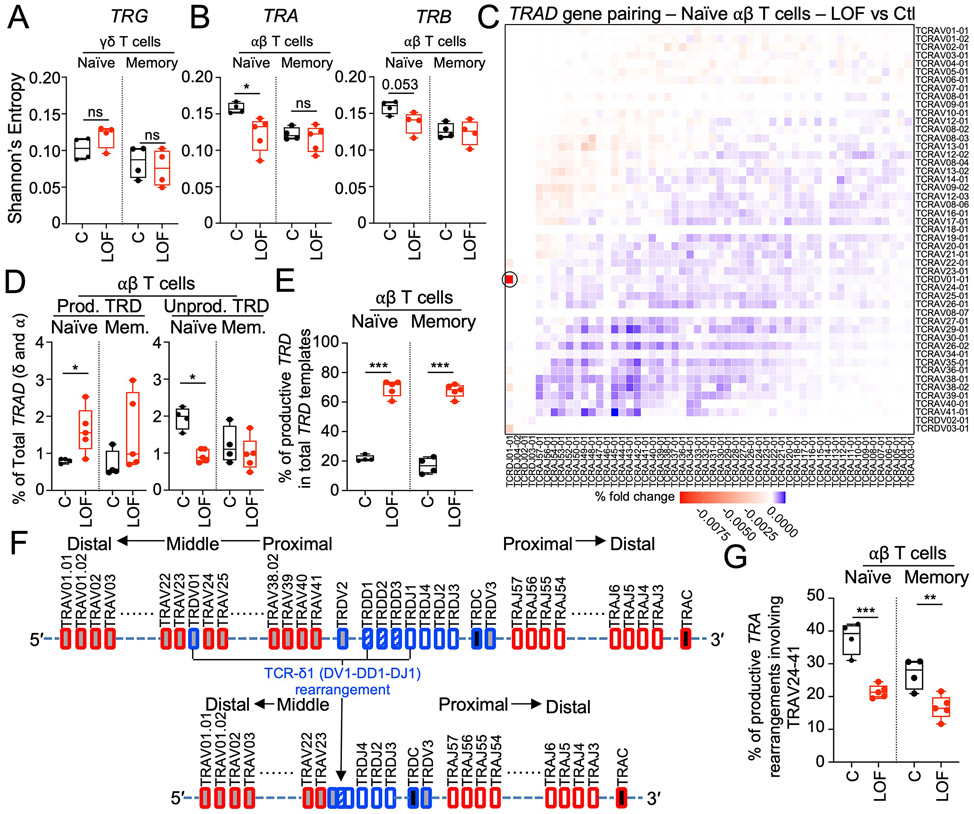
Fig. 5. Biases in the TRAD rearrangement repertoire indicate that TCRα chains are mostly generated by rearrangement of a TCRδ1 template in pre-TCRα–deficient individuals.
(A) Shannon’s entropy for TCRγ rearrangements in naïve and memory γδ T cells from controls (black; n=4) and pre-TCRα–deficient individuals (red; P1, P2, P4, and P8). (B) Shannon’s entropy for TCRα and TCRβ rearrangements in naïve and memory αβ T cells from controls (black; n=4) and pre-TCRα–deficient individuals (red; P1, P2, P4, P8, and P9). (C) Heatmap of paired gene rearrangements at the TRAD locus for naïve αβ T cells from four controls compared with five pre-TCRα–deficient individuals (P1, P2, P4, P8, and P9). The red color highlights V-J gene pairings overused in patients and the blue color highlights V-J gene pairings overused in controls. The TCRδ1 (TRDV1:TRDJ1) rearrangement is indicated with a black circle. (D) Fraction of TCRδ rearrangements in total productive TRAD rearrangements from sorted naïve and memory αβ T cells from controls (black; n=4) and pre-TCRα–deficient individuals (red; P1, P2, P4, P8, and P9). (E) Fraction of productive TCRδ rearrangements among total TCRδ rearrangements in naïve and memory αβ T cells from controls (black; n=4) and pre-TCRα–deficient individuals (red; P1, P2, P4, P8, and P9) (red). (F) Schematic representation of the TRAD locus before and after TCRδ1 rearrangement. (G) Percentage of productive TRA rearrangements involving TRAV24-41 in sorted naïve and memory αβ T cells from controls (black; n=4) and pre-TCRα–deficient individuals (red; P1, P2, P4, P8, P9). Unpaired t tests were used for comparisons in panels A, B, D, and E.

