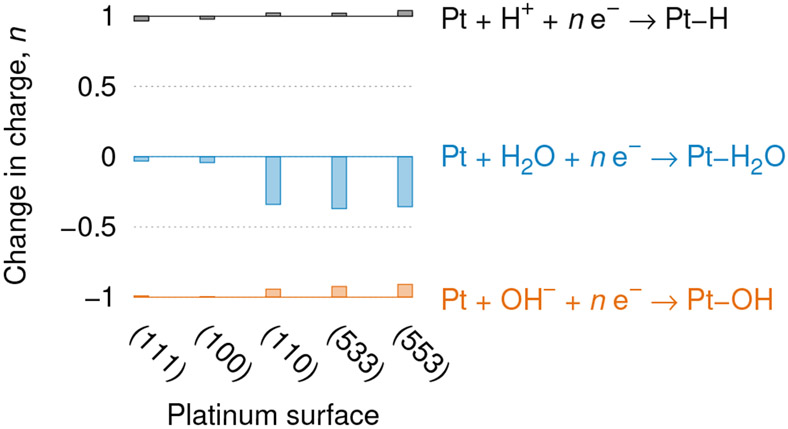
Fig. 2.
Adsorption reactions (right) and corresponding change in number of electrons (left) for different Pt surfaces. Lines indicate the conventionally expected integer charge, while the bars indicate the fractional deviations. See Table 1 for the adsorption sites considered and the corresponding charges.

