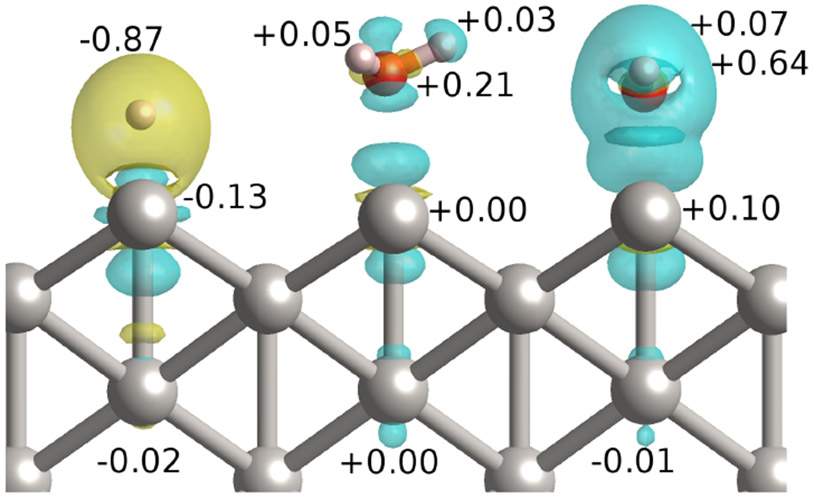
Fig. 3.
Change in charge density upon adsorption of X = H+, H2O and OH− (from left to right) at the step edge of Pt(110). , where the three ’s in order are the charge density of the adsorbed configuration, bare surface and isolated adsorbate species. Cyan and yellow indicate the decrease and increase in electron density respectively. The numbers indicate the corresponding changes in Lowdin charges upon adsorption.

