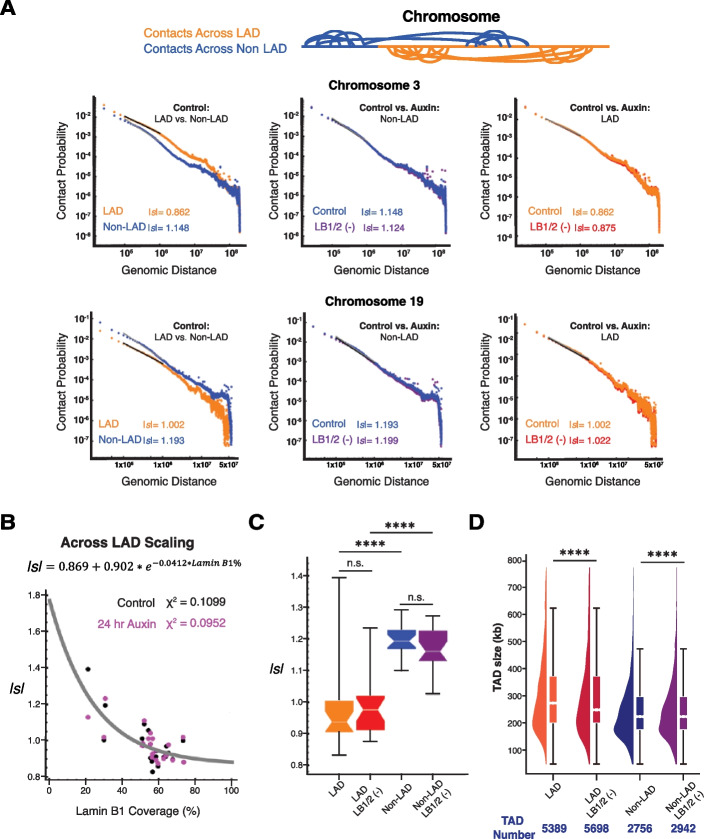
Fig. 4.
Loss of B-type lamins has a negligible impact on genome connectivity. A Contact scaling for chromosomes 3 and 19 located at the nuclear periphery and nuclear interior, respectively, is shown. The left plots indicate contact scaling for each chromosome in the untreated condition to compare LAD and non-LAD segments. The middle and right plots indicate contact scaling for each chromosome to compare the control (untreated) and 24-h auxin treatment conditions in HCT116.LMN(B1&B2)−AID cells. Absolute values of s are indicated. B Scatter plot of the inverse relationship between lamin B1 coverage and |s| in LAD segments. The exponential distribution (gray curve) is fitted to the merged control (black) and 24-h auxin treatment condition (purple) samples. C Contact scaling within LADs and non-LADs for both the control (untreated) and 24-h auxin treatment conditions. Error bars: SEM. The line within each box represents the median; the outer edges of the box are the 25th and 75th percentiles and the whiskers extend to the minimum and maximum values. Significance of the differences in observed frequencies was calculated by unpaired t test (n.s. = not significant; **** < 0.0001). D Raindrop plot comparing TAD sizes for the control and 24-h treatment conditions as revealed by TopDom. The number of TADs for each condition/ segment is indicated below the plot. Error bars: SEM. Significance was calculated by paired t test (**** < 0.0001). For A–D, data was pooled from two independent biological replicates (N = 2)

