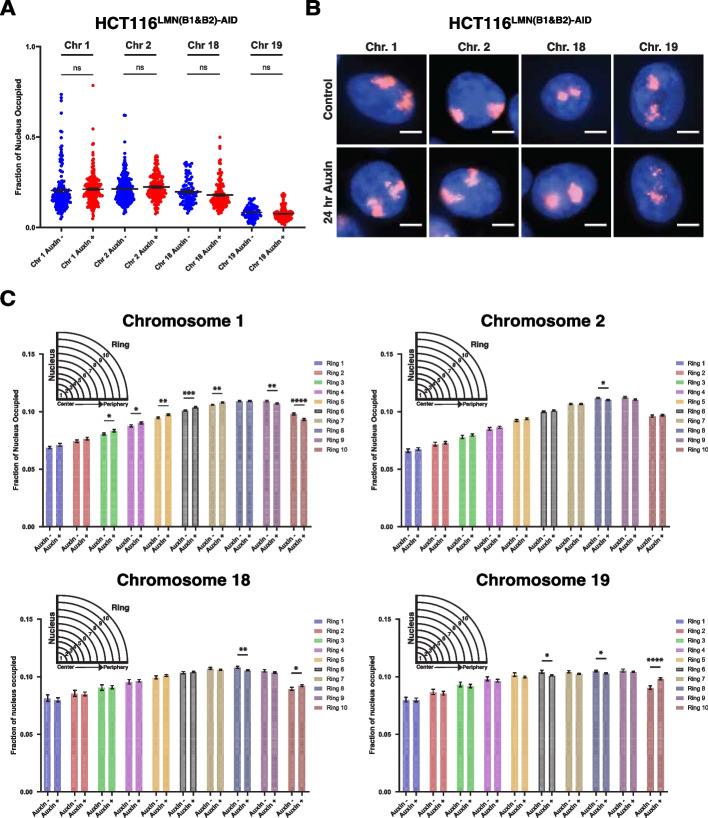
Fig. 5.
Reduced levels of B-type lamins increases chromatin mobility at the nuclear periphery. A Scatterplot of nuclear fraction occupied by chromosomes 1, 2, 18, and 19 before and after 24-h auxin treatment. Error bars: SEM. Data was compiled from three independent biological replicates (N = 3). Significance was calculated by unpaired t test (n.s. = not significant). (Chr. 1 (Control n = 165; Auxin n = 195), Chr. 2 (Control n = 203; Auxin n = 174), Chr. 18 (Control n = 89; Auxin n = 148), Chr. 19 (Control n = 120; Auxin n = 83)). The violin plots extend from the minimum to the maximum value. The line in the middle of each plot is the median value of the distribution, and the lines above and below are the third and first quartiles, respectively. Each dot represents one cell. B Representative immunofluorescence images of HCT116.LMN(B1&B2)−AID cells visualized through the hybridization of chromosome paints. Data are representative of two independent biological replicates (N = 2). C Graphing of the average fraction and SEM of each chromosome fluorescent signal present in each one of ten concentric nuclear rings (ring 1: most central, ring 10: most peripheral). Data was compiled from two independent biological replicates (N = 2). Significance was calculated by unpaired t test (* < 0.05; ** < 0.01; *** < 0.001; **** < 0.0001). (Chr. 1 (Control n = 165; Auxin n = 195), Chr. 2 (Control n = 203; Auxin n = 174), Chr. 18 (Control n = 89; Auxin n = 148), Chr. 19 (Control n = 120; Auxin n = 83))

