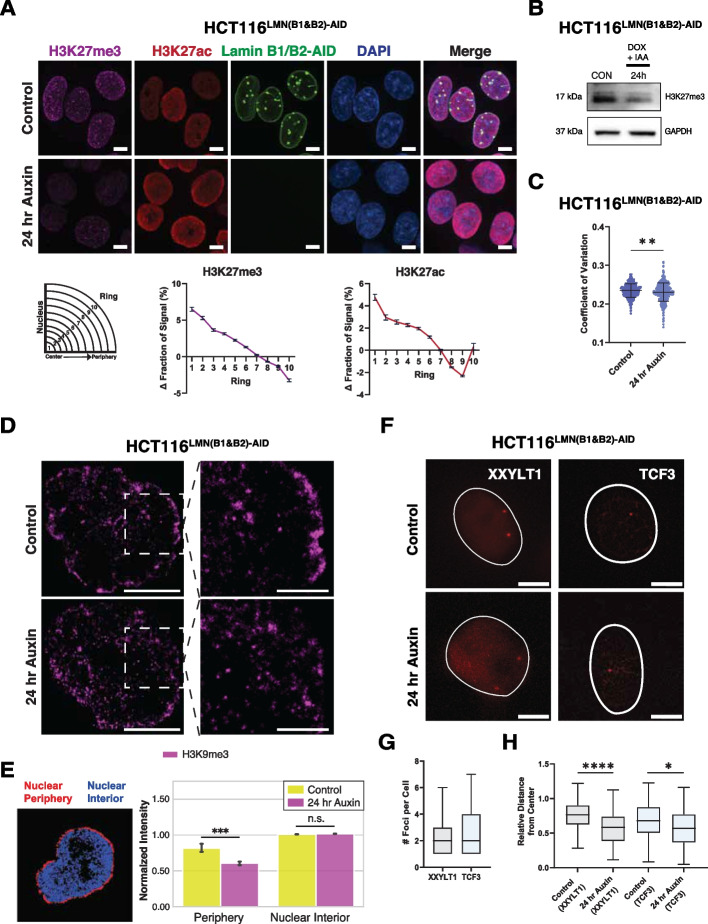
Fig. 7.
Chromatin decompaction promotes redistribution of heterochromatin and gene loci upon auxin treatment. A Immunostaining of H3K27me3 and H3K27ac in HCT116LMN(B1&B2)−AID cells before and after 24-h auxin treatment. Graphing of the average fraction and SEM of fluorescent signal present in each one of ten concentric nuclear rings is shown below. Magenta: H3K27me3. Red: H3K27ac. Green: Lamin B1/B2-AID. Blue: DAPI staining. Maximum intensity projections of nuclear Z stacks and % changes between concentric rings are shown. Scale bars = 5 μm. Error bars: SD. Data are representative of two independent biological replicates (N = 2). (H3K27me3 (Control n = 455; Auxin n = 510), H3K27ac (Control n = 448; Auxin n = 447)). B Western blot analysis of H3K27me3 in HCT116LMN(B1&B2)−AID cells. Doxycycline (DOX) was added 24 h prior to IAA to induce OsTIR1 expression. GAPDH was used as a loading control. Data are representative of three independent biological replicates (N = 3). C Coefficient of variation plot for HCT116LMN(B1&B2)−AID cells showing chromatin decompaction upon 24 h of auxin treatment. Data was compiled from three independent biological replicates (N = 3). Significance was calculated by unpaired t test (**** < 0.0001). (Control n = 798; Auxin n = 845). Violin plots extend from the minimum to the maximum value. The line in the middle of each plot is the median value of the distribution, and the lines above and below are the third and first quartiles, respectively. Each dot represents one cell. D STORM images of HCT116LMN(B1&B2)−AID cells before and after 24-h auxin treatment with zoomed-in views of the nuclear periphery. Magenta: H3K9me3. Scale bars = 5 µm, Scale bars (zoom) = 2 µm. E Quantification of Normalized STORM Intensity (NSI) with a representative segmentation for the nuclear periphery (red) and nuclear interior (blue). Error bars: SD. Significance was calculated by unpaired t test (*** < 0.001). (Control n = 5; Auxin n = 5). F Representative CRISPR-Sirius images of gene loci XXYLT1 and TCF3 in live HCT116LMN(B1&B2)−AID cells. Scale bar = 5 μm. Data are representative of two independent biological replicates (N = 2). G Boxplot showing the number of foci per cell for XXYLT1 and TCF3 loci (XXYLT1 n = 42; TCF3 n = 25). H Box plot showing distances of XXYLT1 and TCF3 foci to the nuclear center. Significance was calculated by Mann–Whitney test (* < 0.05; **** < 0.0001) (XXYLT1 (Control n = 115; Auxin n = 65), TCF3 (Control n = 116; Auxin n = 32)). For G,H, data was compiled from two independent biological replicates (N = 2). The line within each box represents the mean; the outer edges of the box are the 25th and 75th percentiles and the whiskers extend to the minimum and maximum values

