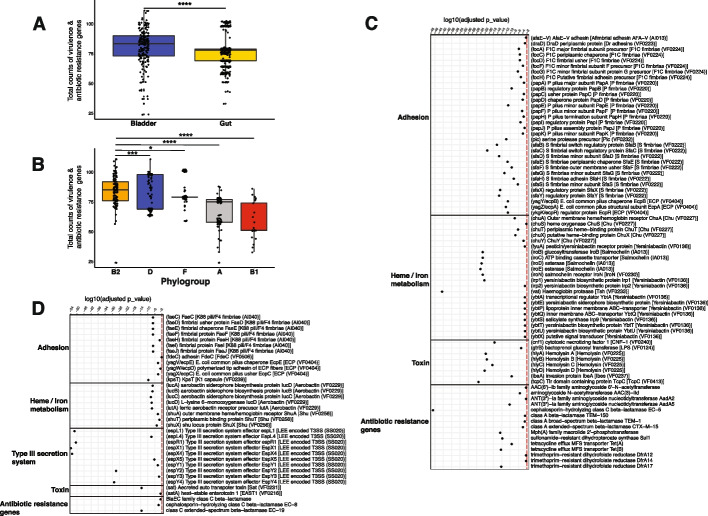
Fig. 5.
Comparison of virulence and antibiotic resistance genes between Escherichia coli reference genomes isolated from the bladder and gut. A Boxplots analysis showing the comparison of counts of virulence and antibiotic resistance genes in the bladder and gut E. coli genomes. Each data point represents the counts of virulence and antibiotic resistance genes in each E. coli genome. B Boxplot analysis showing the comparison of counts of virulence and antibiotic resistance genes in different E. coli phylogroups. Phylogroup G was not shown here due to the low sample size. *, **, ***, **** indicated FDR < 0.05, 0.01, 0.001, and 0.0001, respectively. C Virulence and antibiotic resistance genes that were enriched in bladder E. coli genomes. D Virulence and antibiotic resistance genes that were enriched in gut E. coli genomes. Virulence and antibiotic resistance genes with an FDR of < 0.01 were displayed here

