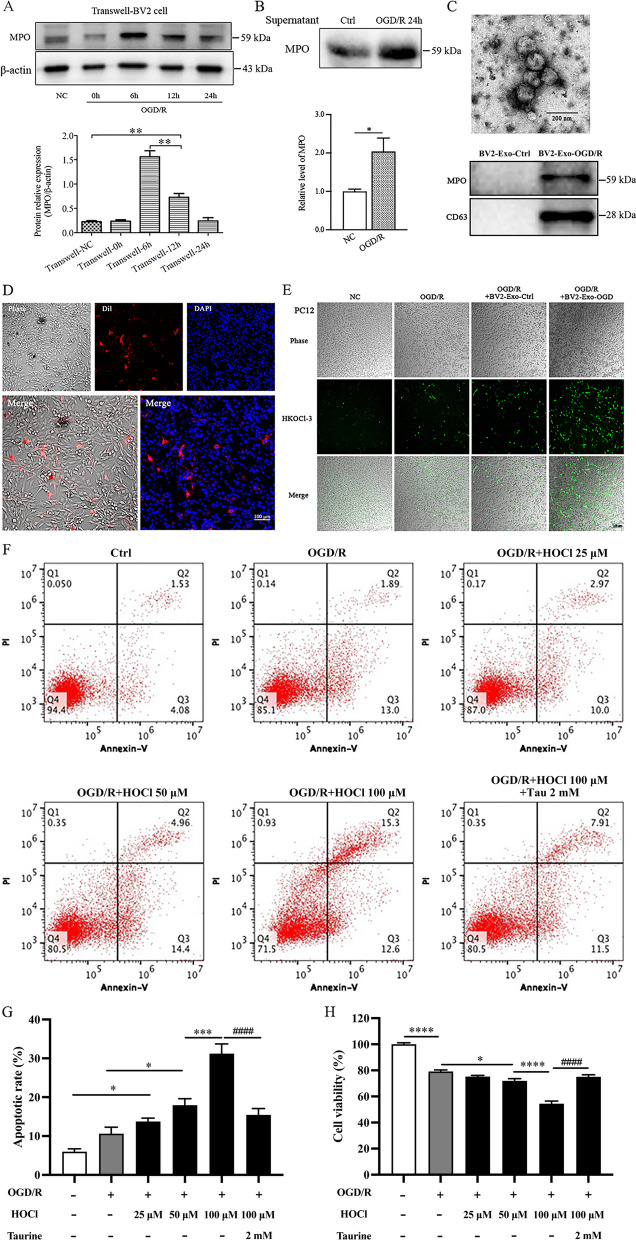
Fig. 3.
MPO-containing exosomes derived from microglial BV2 cells transfer into co-cultured PC12 cells, elevate HOCl level, and induce apoptosis in vitro. Exosomes were collected from the supernatant of BV2 cells after OGD/R-24 h exposure. PC12 cells were treated with HOCl (25, 50, 100 µM) in HBSS for 15 min after exposure to 4 h OGD and re-incubated in normoxic conditions (NC) for 24 h. Taurine (2 mM) was added at the onset of HOCl exposure. A MPO expression in BV2 cells after co-cultured with PC12 cells under NC or OGD/R conditions. B MPO expression in the supernatant of BV2 cells. supernatant of BV2 cells. C Upper panel, exosome image determined by TEM, bar = 200 nm; lower panel, expression of MPO and exosome marker CD63 in BV2-derived exosome. D Uptake of Dil-labeled exosomes by PC12 cells after cultured for 4 h. Bar = 100 μm. E HOCl production in PC12 cells treated with PBS, BV2-Exo-Ctrl or BV2-Exo-OGD/R under NC or OGD/R-24 h, bar = 100 μm. F, G Annexin V-FITC/PI staining flow cytometry for apoptotic cell death. H MTT assay for cell viability in PC12 cells. Transwell-NC: co-culture BV2 and PC12 cells under normal culture conditions; Transwell-0 h, 6 h, 12 h, 24 h: BV2 and PC12 co-cultured cells were exposed to 4 h OGD with 0 h, 6 h, 12 h, and 24 h of reoxygenation; BV2-Exo-Ctrl: exosomes released from NC-conditioned BV2 cells; BV2-Exo-OGD/R: exosomes released from OGD/R-stimulated BV2 cells. *p < 0.05, **p < 0.01, ***p < 0.001, ****p < 0.0001, ####p < 0.0001. All data are presented as mean ± SEM. (Statistical methods: A, G, F one-way ANOVA followed by Tukey’s multiple comparisons test; B two-tailed t-test.)

