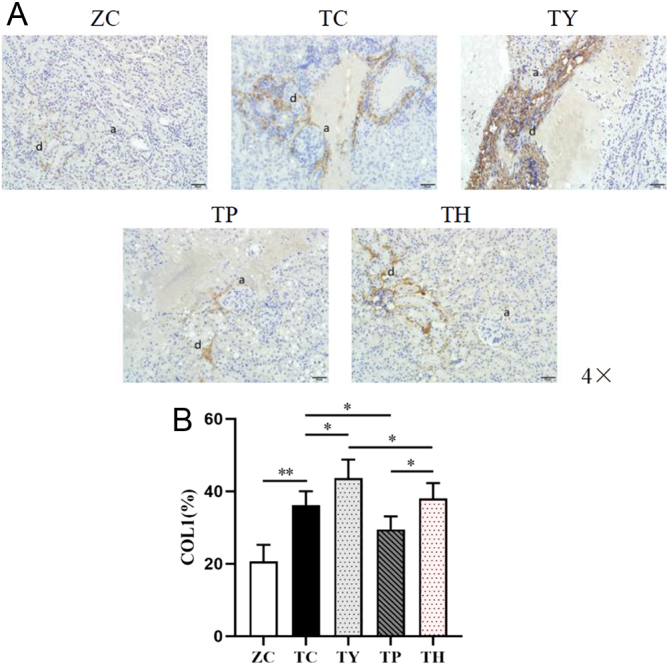
Figure 6.

COL1 localization and expression in the kidney of each group. (A) Representative images of immunohistochemical staining. Bar: 50 μm. (B) The percentage variation of positive area of COL1 expression. (a) Glomerulus. (d) COL1. *P < 0.05, **P < 0.01.

 This work is licensed under a