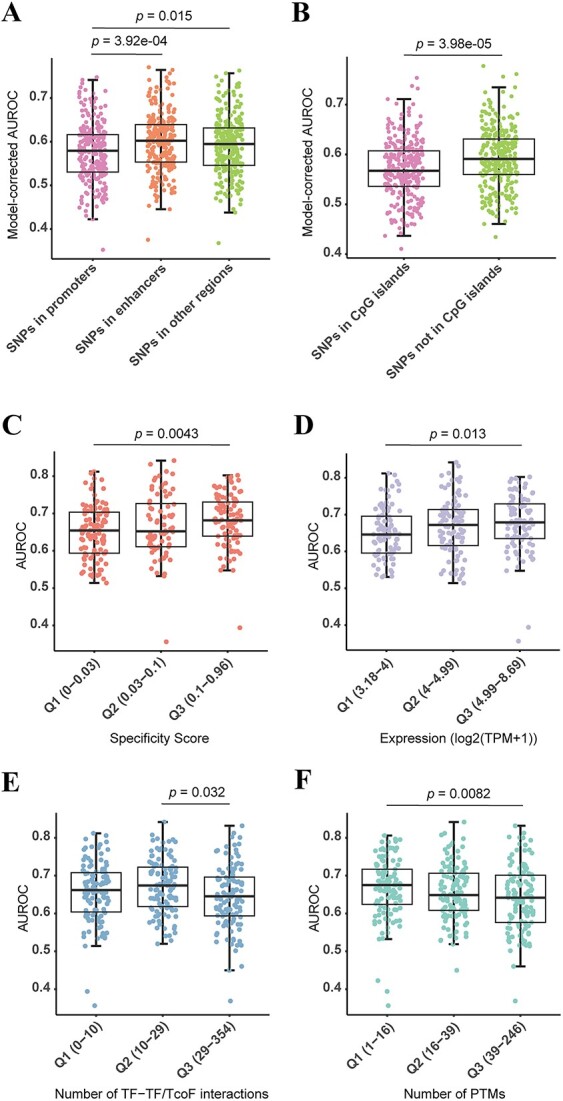
Figure 5.

Performance of TFs is influenced by in vivo properties of DNA and TFs. (A, B) Box plot showing the model-corrected AUROCs of TFs with SNPs, where (A) the SNPs are located in enhancers, promoters and other genomic regions, and (B) the SNPs are located in CpG islands and non-CpG islands. AUROCs are predicted by the ASB data. Each dot represents one TF. P-values calculated by two-sided Tukey’s test and corrected by Benjamini–Hochberg (BH) method are shown. (C–F) Performances of TFs have some associations with their properties based on in vivo ASB data. Performances of TFs in different groups of expression specificity (0, if a gene was transcribed at the same frequency in all tissues; 1, if a gene was expressed in only one tissue) (C), expression levels (D), TF-TF/TcoF interactions (E) and PTMs (F). Each dot represents one TF. The groups are divided according to the tertiles (Q1–Q3). P-values calculated by two-sided Dunn’s test and corrected by BH method are shown.
