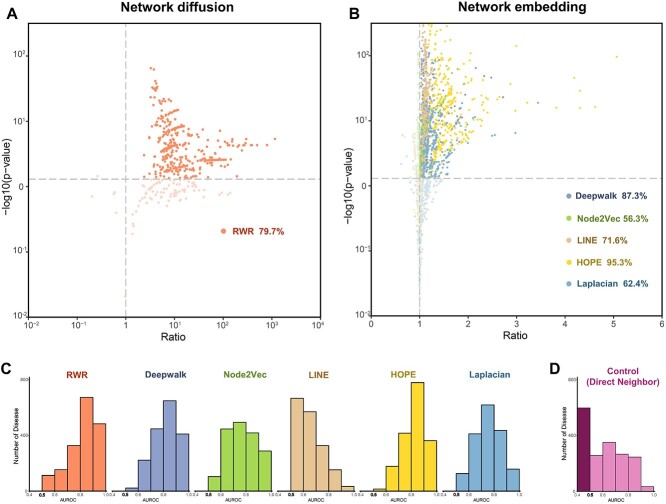
Figure 2.
Evaluation of the gene distance for disease signals based on six different network linkage algorithms. (A) For the RWR algorithm, transfer probability was used to measure the distance between genes. The scatter plot depicts the distance difference between DDD and DND among diseases, with each point corresponding to one disease. DDD: distance between disease gene and disease gene. DND: distance between non disease gene and disease gene. Ratio = mean (DDD)/mean (DND). P-value was obtained by t-test. (B) For the five embedding algorithms, cosine similarity was used to measure the distance between genes. It reflects the distance differences between DDD and DND in various diseases, with each point representing one disease. (C) AUC for gene distances from six algorithms to distinguish disease gene among 1750 diseases. Histograms were used to describe the AUC distribution. (D) AUC for control method (guilt by association) to distinguish disease gene among 1750 diseases.

