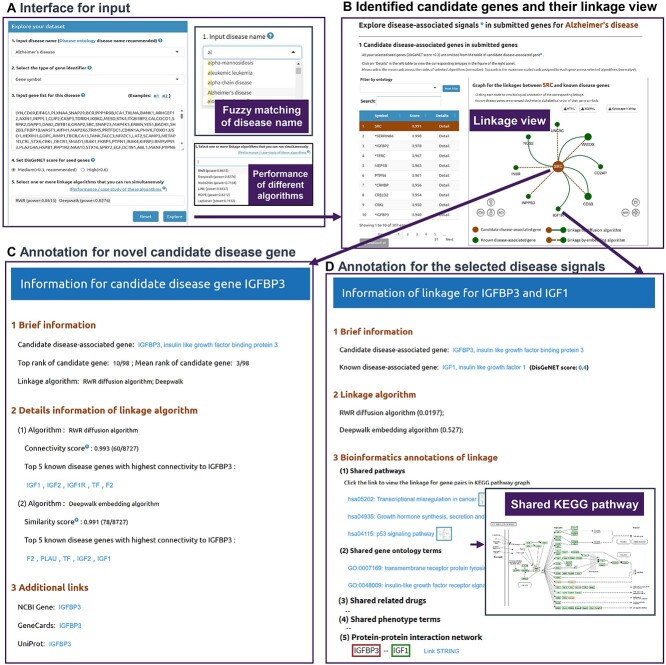
Figure 4.
DDK-Linker interactive interface allows users to uncover disease signals. (A) The input interface accepts the disease name designated by users and the related gene list of interest from a high-throughput omics dataset. The user can customize parameters, such as disease gene confidence score and network linkage algorithms. DDK-Linker can present power scores for each disease under different algorithms. (B) Network view for disease signals shows the linkages between candidate disease–associated genes and known disease–associated genes. The central node represents the candidate disease gene from GOIs and the surrounding nodes are the known disease genes. There are two types of linkages representing different link algorithms: the solid line represents the association from network diffusion strategy, and the dashed line represents the association from network embedding strategy. Users can click each node/edge to view detailed annotations of the corresponding linkage (C, D). (C) Bioinformatics annotations for the candidate disease–associated gene. (D) Detailed information for certain disease signal between candidate disease–associated gene and known disease–associated gene. The inset graph shows the graph to illustrate this linkage in KEGG pathway.

