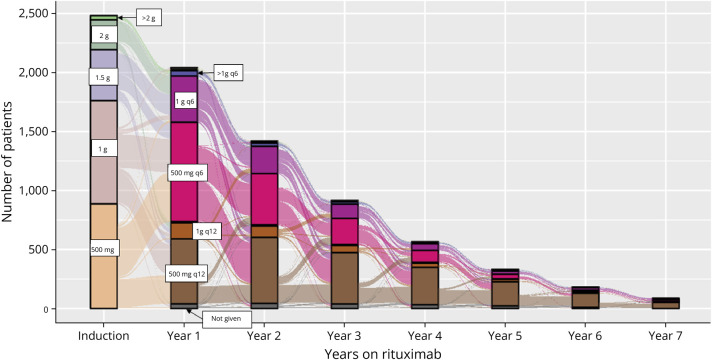
Figure 3. Patient Flow Through Rituximab Dosing Schedules After Treatment Initiation.
Depicted is the total number of patients on various rituximab dosing schedules throughout the study period. Induction doses and maintenance doses and frequencies are indicated by color and labeled in the diagram. The most common induction doses were 500 mg (n = 887, 35.7%) and 1,000 mg (n = 875, 35.3%). The most common maintenance dose during the first year after first rituximab infusion was 500 mg every 6 months (q6mo in hot pink; n = 842, 41.3% of the 2,040 patients who received at least 1 infusion that year). During year 2, use of 500 mg q12 months (q12mo in brown, n = 559, 39.3%) was slightly higher than 500 mg q6mo (n = 424, 30.6%), and over time, 500 mg q12mo was the most common dosing schedule used (65.4% by year 6). The total number of patients receiving at least 1 dose of rituximab in a particular year declined with each year of follow-up (n = 565 in year 4, n = 182 in year 6) reflecting primarily year of treatment initiation and follow-up time rather than treatment discontinuation.

