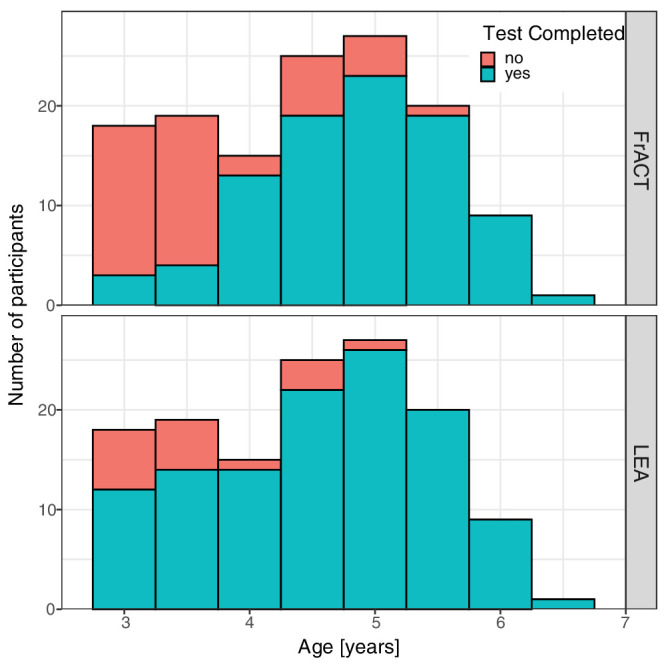
Figure 2.

Testability of VA with FrACT (top) and LEA (bottom). For each age group (in 0.5-year steps), the number of patients with successful (blue-green) and failed (red) VA test completion is shown. Successful test completion (“yes”) means test completion in each eye. Age ranges as in Figure 1.
