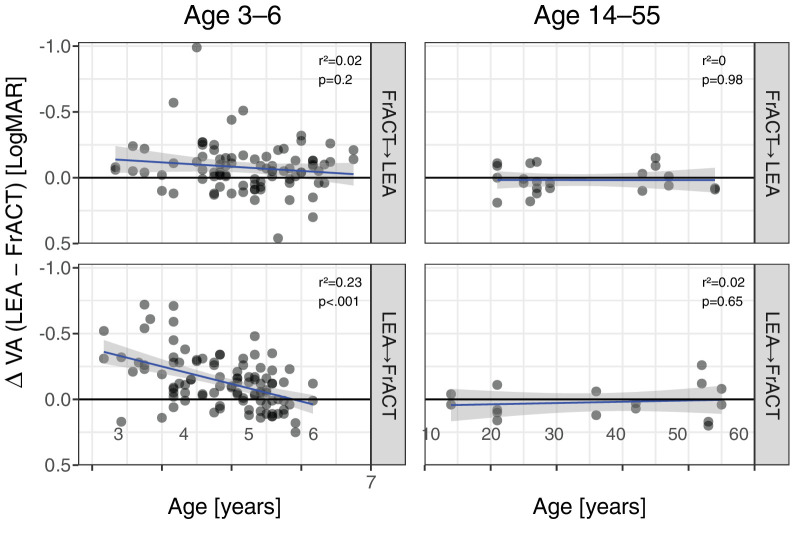
Figure 4.
Difference of VA as reported by LEA minus FrACT versus age. Note the inverted logMAR scale: better acuity up. The thick blue lines represent linear fits with corresponding 95% confidence intervals (gray shaded). The ordinate displays the difference between LEA and FrACT VAs (in logMAR) for eyes of participants who completed both tests. On the abscissa, the age range (in years) was divided in children (left) and older study participants (right). Top row: FrACT first. Bottom row: LEA first. Note that VA differences in children highly depended on test sequence (compare left row top and bottom). P values and r² are given at the top right of each panel.

