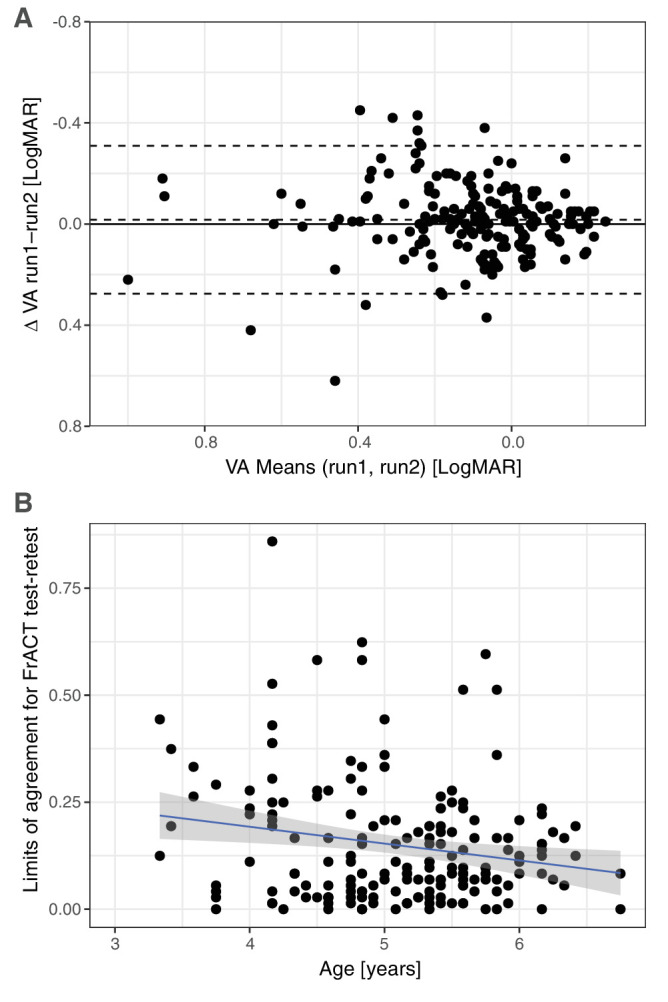
Figure 5.

Test–retest variability of FrACT. (A) Bland–Altman plot of FrACT results when two runs were available. The solid line depicts the zero line. Bias (difference between zero line and middle dashed line) is low (−0.02 logMAR). The dashed lines represent ±95% limits of agreement (±0.298 logMAR). (B) Individual limits of agreement versus age, showing wide variability and a small decline with age (r = −0.20, P = 0.0075; LoA = 0.35–0.039 * age): the linear regression explains only 4% of the variance.
