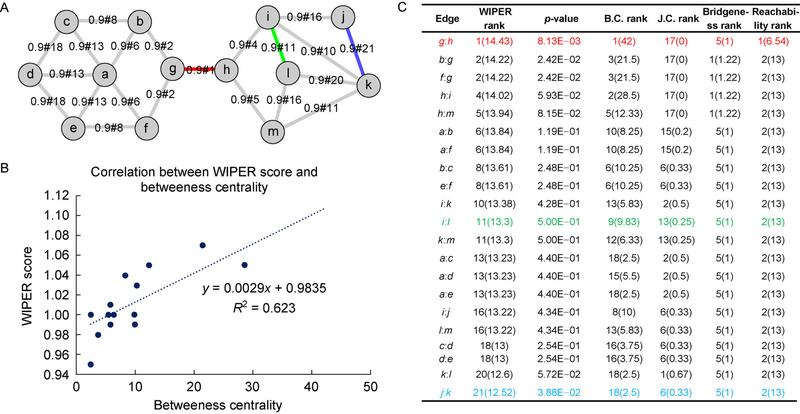
Figure 3. A synthetic network case-study shows moderated correlation between WIPER and edge betweenness centrality.
Color edges are the highest-ranked ones from WIPER. (A) The network layout. (B) Correlation between WIPER and edge betweenness centrality. (C) Comparisons between WIPER and four other indexes of edges.

