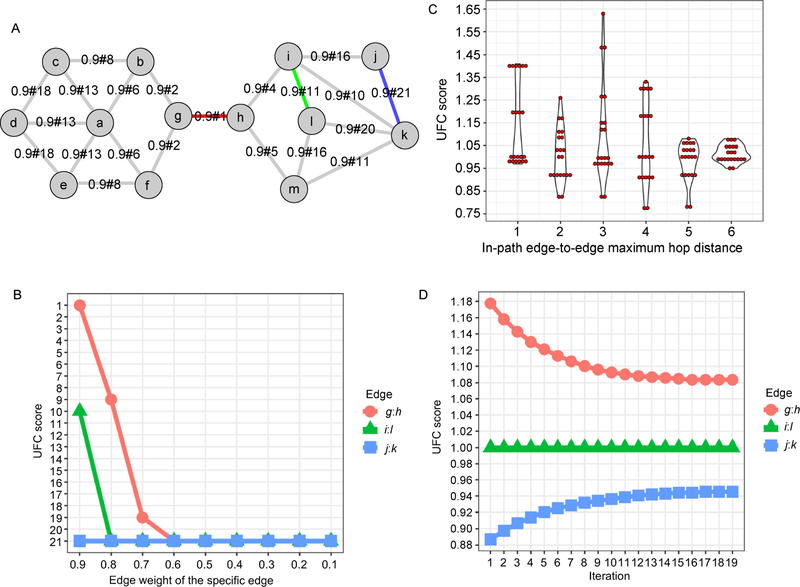
Figure 4. A synthetic network case-study shows the parameter effect on the WIPER rank.
Color edges are the highest-ranked ones from WIPER. (A) The network layout. (B) The UFC rank changes according to the solely independently decreasing the original edge weight of the specific edge (g:h, i:l and j:k edges). (C) The violin plot of the UFC score distribution influenced by the in-path edge-to-edge maximum hop distance cutoff. (D)The UFC score range is influenced by the iteration of the “ant-colony” algorithm.

