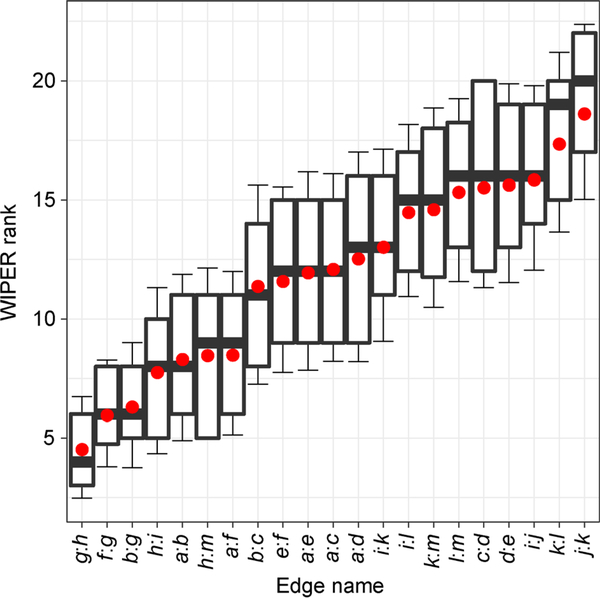
Figure 6. The re-rank of the edge under the initial weight randomization for 100 times.
The x-axis is the assigned edge with remained initial weight as 0.7. The y-axis is the WIPER rank. The box plot middle line is the medium, the upper line is 75%, the bottom line is 25%. The bar is the standard deviation. The red spot is the mean.

