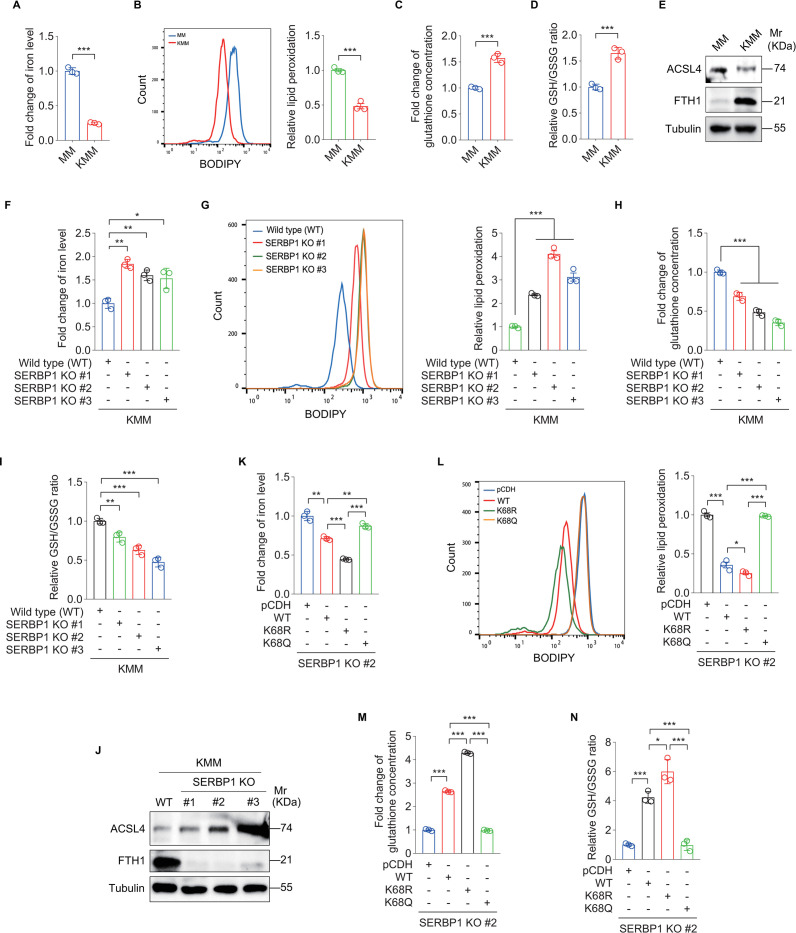
Fig 2. SERBP1 deacetylation mediates KSHV-induced cellular transformation by inhibiting ferroptosis.
(A). Levels of iron in MM and KMM cells. (B). Flow cytometry analysis of lipid peroxidation level in MM and KMM cells (left). The lipid peroxidation level of indicated cells was shown in bar graph (right). Data represented the mean ± SEM of three independent experiments. (C). Levels of total glutathione in MM and KMM cells. (D). Levels of GSH/GSSG ratio in MM and KMM cells. (E). Western blotting analysis of ACSL4 and FTH1 in MM and KMM cells. (F). Levels of iron in three SERBP1 knockout monoclonal KMM cell lines (SERBP1 KO #1, KO #2, and KO #3). (G). Flow cytometry analysis of lipid peroxidation level in three SERBP1 knockout monoclonal KMM cell lines (SERBP1 KO #1, KO #2, and KO #3) (left). The lipid peroxidation level of indicated cells was shown in bar graph (right). Data represented the mean ± SEM of three independent experiments. (H). Levels of total glutathione in three SERBP1 knockout monoclonal KMM cell lines (SERBP1 KO #1, KO #2, and KO #3). (I). Levels of GSH/GSSG ratio in three SERBP1 knockout monoclonal KMM cell lines (SERBP1 KO #1, KO #2, and KO #3). (J). Western blotting analysis of ACSL4 and FTH1 in three SERBP1 knockout monoclonal KMM cell lines (SERBP1 KO #1, KO #2, and KO #3). (K). Levels of iron in SERBP1 knockout KMM cells (SERBP1 KO #2) transduced with lentiviral wild type SERBP1 (WT), K68R mutant SERBP1 (K68R), K68Q mutant SERBP1 (K68Q) or its control lentivirus pCDH (pCDH). (L). Flow cytometry analysis of lipid peroxidation level in cells treated as in (K) (left). The lipid peroxidation level of indicated cells was shown in bar graph (right). Data represented the mean ± SEM of three independent experiments. (M). Levels of total glutathione in cells treated as in (K). (N). Levels of GSH/GSSG ratio in cells treated as in (K). Data were shown as mean ± SD unless indicated else. *P < 0.05, **P < 0.01, and ***P < 0.001, Student’s t-test.

