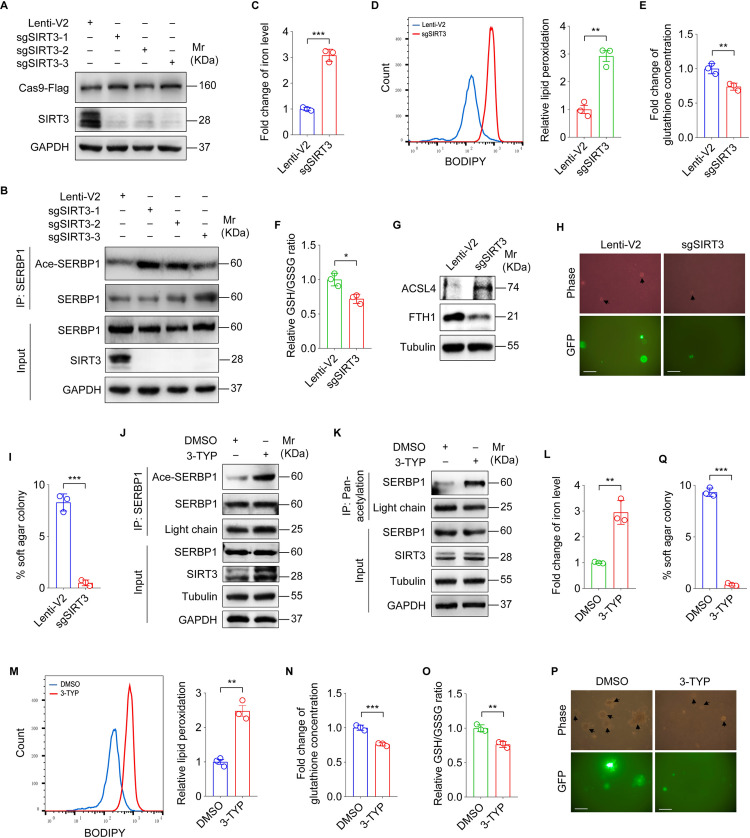
Fig 4. SIRT3 inhibits ferroptosis and promotes KSHV-induced cellular transformation by deacetylating SERBP1.
(A). Western blotting analysis of SIRT3 in KMM cells infected with lentiviral sgSIRT3-1 (sgSIRT3-1), sgSIRT3-2 (sgSIRT3-2), sgSIRT3-3 (sgSIRT3-3), or its control lenti-V2 (Lenti-V2). (B). Cells treated as in (A) were utilized to examine the acetylation level of SERBP1 by immunoprecipitating with anti-SERBP1 antibody. (C). Levels of iron in SIRT3-knockdown KMM cells. (D). Flow cytometry analysis of lipid peroxidation level in SIRT3-knockdown KMM cells (left). The lipid peroxidation level of indicated cells was shown in bar graph (right). Data represented the mean ± SEM of three independent experiments. (E). Levels of total glutathione in SIRT3-knockdown KMM cells. (F). Levels of GSH/GSSG ratio in SIRT3-knockdown KMM cells. (G). Western blotting analysis of ACSL4 and FTH1 in SIRT3-knockdown KMM cells. (H). Soft agar assay of SIRT3-knockdown KMM cells. The representative images were captured at 2 weeks post seeding. Magnification, ×100. Scar bars, 40 μm. The representative images were taken from three randomly selected fields of each sample. (I). Quantification of the results in (H). Colonies with a size equal to or larger than 20 μm (arrows shown in H) were counted to calculate the percentage of soft agar colonies. (J). KMM cells were treated with 3-TYP for 24 h, and cell lysates were immunoprecipitated with anti-SERBP1 antibody. The acetylation of SERBP1 was standardized by total SERBP1 levels. (K). KMM cells were treated with 3-TYP for 24 h, and cell lysates were immunoprecipitated with anti-acetylated-lysine antibody to examine SERBP1 level with anti-SERBP1 antibody by immunoblotting assay. (L). Levels of iron in KMM cells treated with 3-TYP or its control DMSO. (M). Flow cytometry analysis of lipid peroxidation level in KMM cells treated with 3-TYP or its control DMSO (left). The lipid peroxidation level of indicated cells was shown in bar graph (right). Data represented the mean ± SEM of three independent experiments. (N). Levels of total glutathione in KMM cells treated with 3-TYP or its control DMSO. (O). Levels of GSH/GSSG ratio in KMM cells treated with 3-TYP or its control DMSO. (P). Soft agar assay of KMM cells treated with 3-TYP or its control DMSO. The representative images were captured at 2 weeks post seeding. Magnification, ×100. Scar bars, 40 μm. The representative images were taken from three randomly selected fields of each sample. (Q). Quantification of the results in (P). Colonies with a size equal to or larger than 20 μm (arrows shown in P) were counted to calculate the percentage of soft agar colonies. Data were shown as mean ± SD unless indicated else. *P < 0.05, **P < 0.01, and ***P < 0.001, Student’s t-test.

