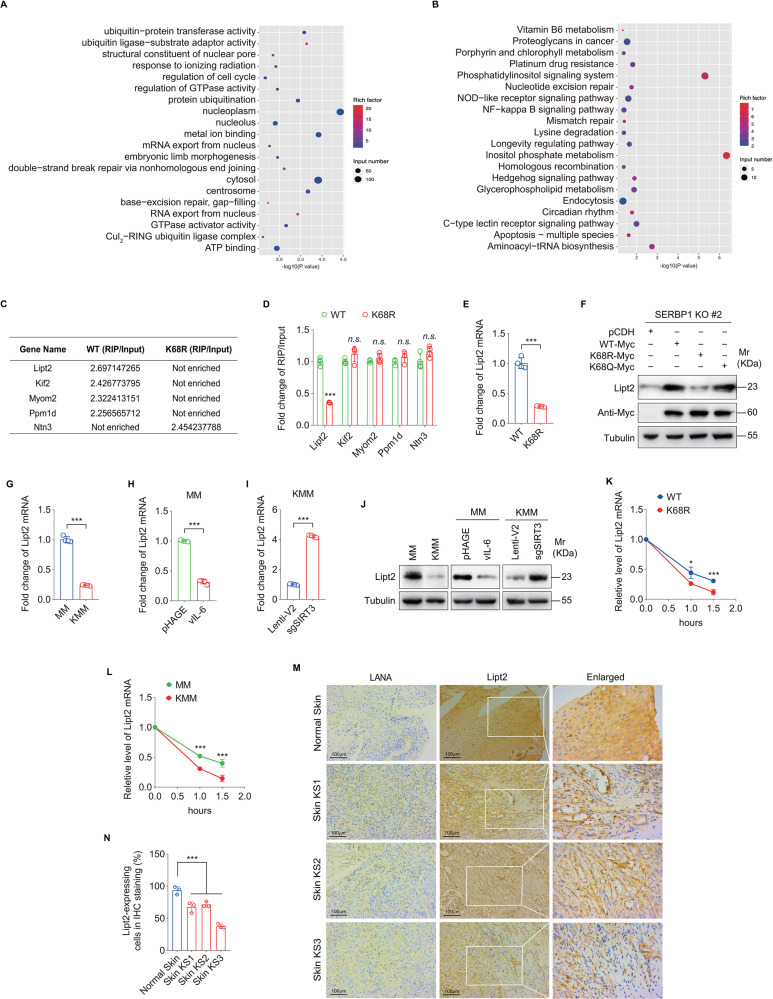
Fig 6. Deacetylated SERBP1 interacts with less Lipt2 mRNA and increases its instability.
(A). GO enrichment analyses of SERBP1 knockout (KO) KMM cells transduced with lentiviral wild type SERBP1 (WT) or K68R mutant SERBP1 (K68R). (B). KEGG pathway of SERBP1 knockout (KO) KMM cells transduced with lentiviral wild type SERBP1 (WT) or K68R mutant SERBP1 (K68R). (C). Differentially interacted mRNAs obtained in 3 paired samples from SERBP1 knockout (KO) KMM cells transduced with lentiviral wild type SERBP1 (WT) or K68R mutant SERBP1 (K68R). (D). RNA immunoprecipitation followed by qPCR analysis of the interaction between SERBP1 and differentially interacted mRNAs in SERBP1 knockout (KO) KMM cells transduced with lentiviral wild type SERBP1 (WT) or K68R mutant SERBP1 (K68R). GAPDH was used as a control. (E). RT-qPCR analysis of Lipt2 mRNA level in SERBP1 knockout (KO) KMM cells transduced with lentiviral wild type SERBP1 (WT) or K68R mutant SERBP1 (K68R). (F). Western blotting analysis of Lipt2 expression in SERBP1 knockout (KO) KMM cells transduced with lentiviral wild type SERBP1 (WT-Myc), K68R mutant SERBP1 (K68R-Myc), or K68Q mutant SERBP1 (K68Q-Myc). (G). RT-qPCR analysis of Lipt2 mRNA level in MM and KMM cells. (H). RT-qPCR analysis of Lipt2 mRNA level in MM cells transduced with lentiviral vIL-6 or its control pHAGE. (I). RT-qPCR analysis of Lipt2 mRNA level in KMM cells infected with lentiviral sgSIRT3 (sgSIRT3) or its control lenti-V2 (Lenti-V2). (J). Western blotting analysis of Lipt2 expression of cells treated as in (G), (H), and (I), respectively. (K). SERBP1 knockout (KO) KMM cells transduced with lentiviral wild type SERBP1 (WT) or K68R mutant SERBP1 (K68R) were treated with actinomycin D. RNA decay assay was performed to detect the degradation rate of Lipt2 mRNA. (L). MM or KMM cells were treated with actinomycin D. RNA decay assay was performed to examine the degradation rate of Lipt2 mRNA. (M). Immunohistochemical staining (IHC) of Lipt2 in normal skin, skin KS of patient #1 (Skin KS1), skin KS of patient #2 (Skin KS2), and skin KS of patient #3 (Skin KS3). Magnification, ×200, ×400. (N). Quantification of the results in (M). Data were shown as mean ± SD unless indicated else. *P < 0.05 and ***P < 0.001, Student’s t-test. n.s., not significant.

