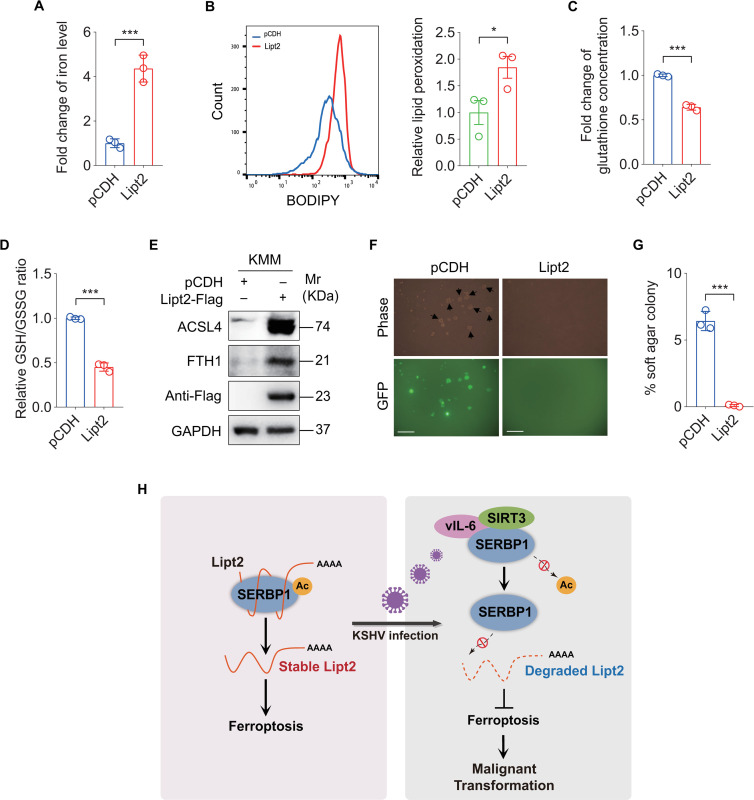
Fig 7. Overexpression of Lipt2 promotes ferroptosis and inhibits KSHV-induced cellular transformation.
(A). Levels of iron in KMM cells transduced with lentiviral Lipt2-Flag (Lipt2-Flag) and its control pCDH (pCDH). (B). Flow cytometry analysis of lipid peroxidation level in cells treated as in (A) (left). The lipid peroxidation level of indicated cells was shown in bar graph (right). Data represented the mean ± SEM of three independent experiments. (C). Levels of total glutathione in cells treated as in (A). (D). Levels of GSH/GSSG ratio in cells treated as in (A). (E). Western blotting analysis of ACSL4 and FTH1 in cells treated as in (A). (F). Soft agar assay of cells treated as in (A). The representative images were captured at 2 weeks post seeding. Magnification, ×100. Scar bars, 40 μm. The representative images were taken from three randomly selected fields of each sample. (G). Quantification of the results in (F). Colonies with a size equal to or larger than 20 μm (arrows shown in F) were counted to calculate the percentage of soft agar colonies. (H). A schematic working model of the mechanism by which SERBP1 deacetylation contributes to KSHV-induced cellular transformation by inhibiting ferroptosis. Data were shown as mean ± SD unless indicated else. *P < 0.05 and ***P < 0.001, Student’s t-test.

