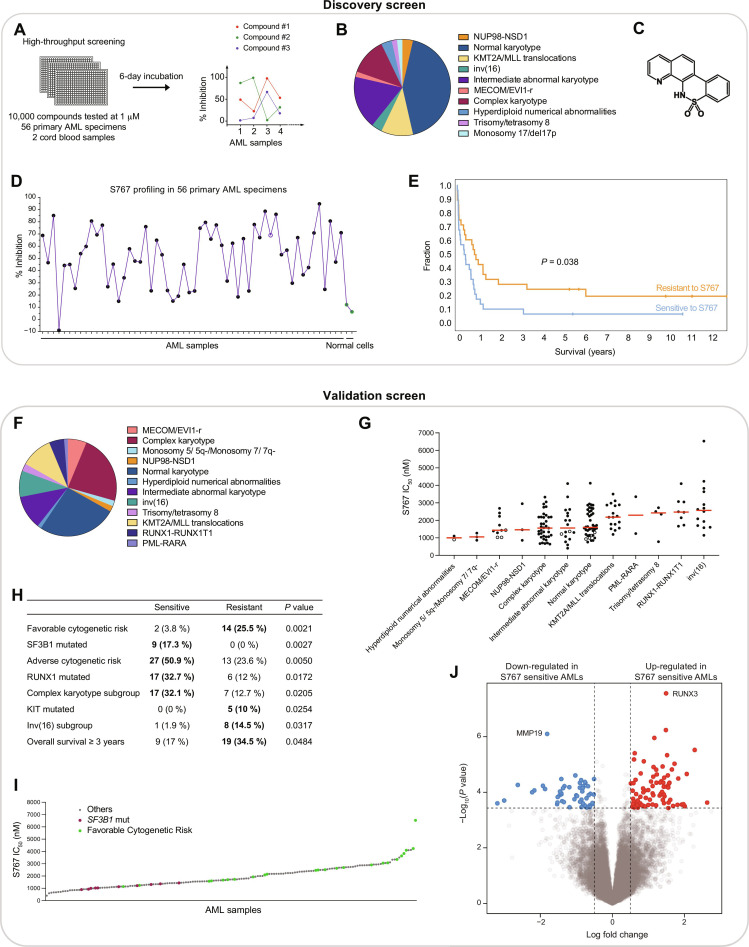
Fig. 1. High-throughput screening in primary specimens identifies S767 targeting SF3B1-mutated and poor-prognosis AMLs.
(A) High-throughput screening strategy. (B) AML subtype classification of the 56 primary specimens used in discovery screen. (C) Chemical structure of S767. (D) Inhibitory profile of S767 compound across 56 primary AML specimens (black dots) and 2 normal cord blood samples (green dots). Percentage of inhibition at 1 μM, normalized to dimethyl sulfoxide (DMSO) control treatment. Empty dot represents SF3B1-mutated sample. (E) Survival curve comparing the more sensitive (n = 28) versus the more resistant (n = 28) AML samples to S767, according to the median distribution. (F) AML subtype classification of the 161 primary AML specimens used in the validation screen. (G) Dot plot distribution of S767 IC50 values across 161 primary AMLs. The 10 samples carrying SF3B1 mutation are displayed as empty dots. Median is represented in red. (H) Associations with S767 compound response were calculated by comparing the more sensitive (tier 1) and the more resistant (tier 3) AML specimens according to cytogenetic risks, AML subgroups, clinical data, and mutational status available for each variable tested. Only significant enrichments (P value < 0.05) are displayed. The number and percentage of samples present in sensitive versus resistant group is depicted. (I) Waterfall representation of S767 IC50 values obtained in the 161 primary AML specimens. (J) Volcano plot representation of differentially expressed genes in S767 sensitive (tier1) versus resistant (tier3) AMLs.

