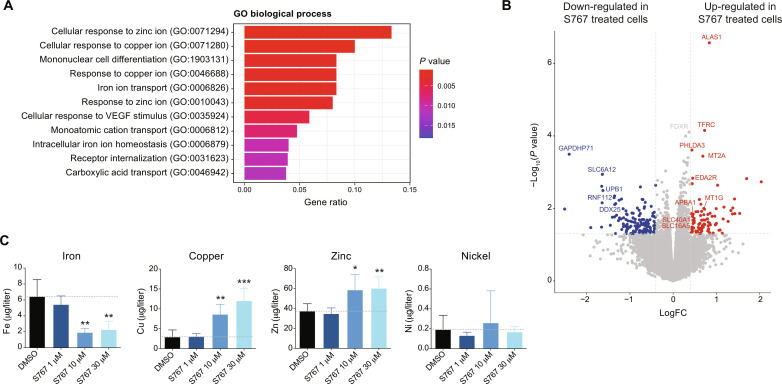
Fig. 2. S767 exposure disrupts intracellular metal homeostasis.
(A) Pathway analysis showing the biological processes significantly enriched in up-regulated genes [P value <0.05, log fold change (FC) > 0.4] following S767 treatment (1 μM, 24 hours), compared to DMSO. Top 11 gene ontology (GO) terms are shown in descending order. VEGF, vascular endothelial growth factor. (B) Volcano plot representing differentially expressed genes in S767 treated OCI-AML5 cells (1 μM, 24 hours) compared to DMSO. (C) Intracellular metal quantification by ICP-MS in OCI-AML5 cells exposed 3 hours to increasing concentration of S767. Data are represented as mean ± SD (n = 5, unpaired t test compared to DMSO condition).

