
Figure 2.
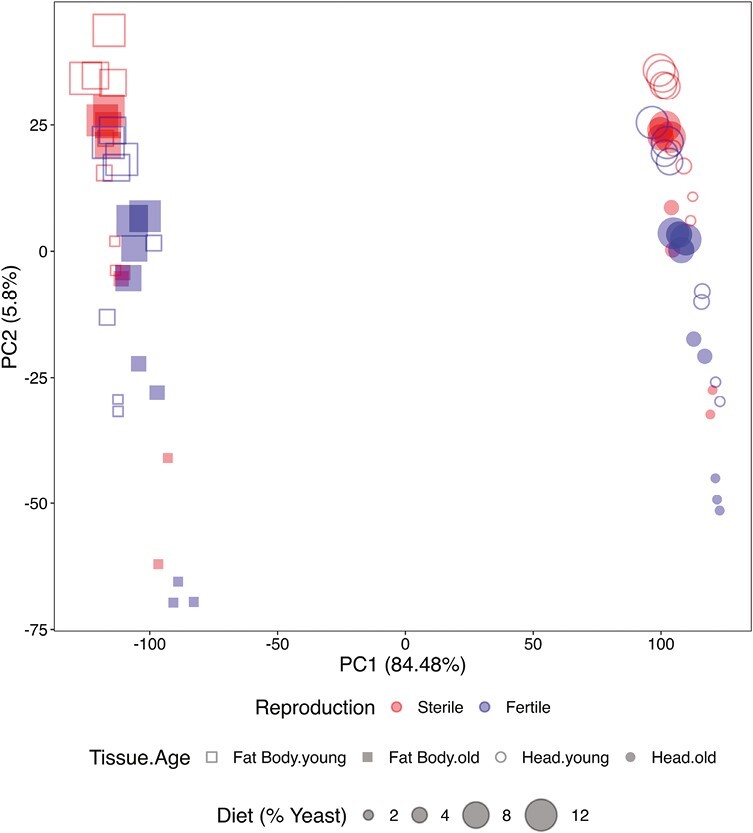
PCA of differentially expressed genes (DEG). PC1 separates the expression data by tissue (fat body vs. head), whereas PC2 separates the data by yeast levels and, more weakly, by reproductive status (germline-less vs. fertile flies). PCA plots based on normalized reads. Red symbols: germline-less (sterile) flies; blue symbols: fertile flies; squares: fat body; circles: heads; open symbols: young flies; filled symbols: old flies. Different symbol sizes represent the different yeast concentrations, ranging from smallest (2%) to largest (12%).