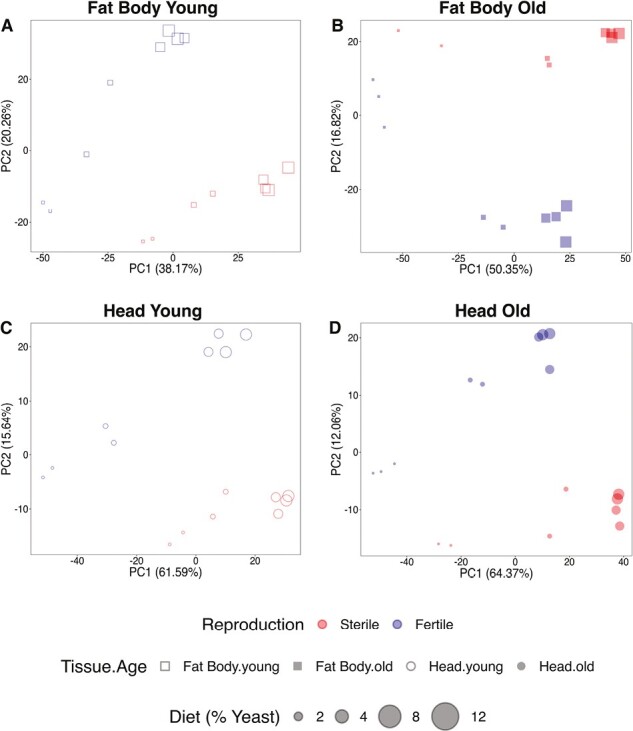
Figure 3.

PCAs of differentially expressed genes (DEG) by tissue and age. (A–D) represent separate PCAs for each data sub-dataset: (A) fat body, young; (B) fat body, old; (C) head, young; and (D) head, old. In all four subsets, the two reproductive states (germline-less vs. fertile) are separated into distinct expression groups. PCA plots based on normalized reads. Red symbols: germline-less (sterile) flies; blue symbols: fertile flies; squares: fat body; circles: heads; open symbols: young flies; filled symbols: old flies. Different symbol sizes represent the different yeast concentrations, ranging from smallest (2%) to largest (12%).
