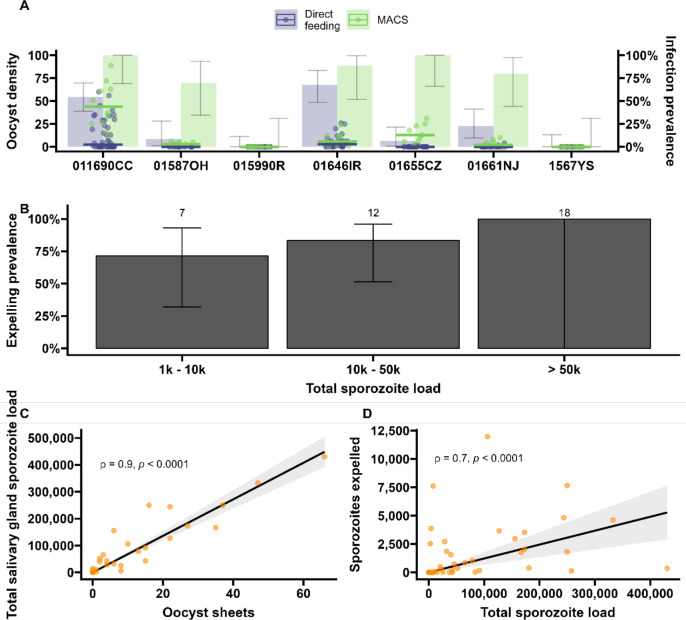
Figure 4. Sporozoite expelling in relation to infection load in Anopheles coluzzii mosquitoes infected by naturally acquired gametocyte infections in Burkina Faso.
(A) Direct feeding (blue) vs magnetic-activated cell sorting (MACS; green). Bars show the infection prevalence for each of the seven gametocyte carriers. Scatter plots with median lines show the midgut oocyst density as a result of direct feeding (blue) and MACS (green). (B) Binning of total sporozoite load and expelling prevalence (N = 25). (C) Scatter plot of absolute numbers of ruptured oocyst (sheet) density assessed by fluorescent microscopy vs total salivary gland sporozoite density assessed by COX-I qPCR; ρ = 0.90 (95% CI, 0.80–0.95). The line represents the fitted linear regression line and the gray shaded area is the 95% CI. (D) Scatter plot of absolute numbers of total sporozoite density (residual salivary gland sporozoites + sporozoites expelled) and sporozoites expelled into the artificial skin assessed by COX-I qPCR; ρ = 0.70 (CI, 0.52–0.82). The line represents the fitted linear regression line, the intercept is forced to zero for biological plausibility, and the gray shaded area is the 95% CI.

