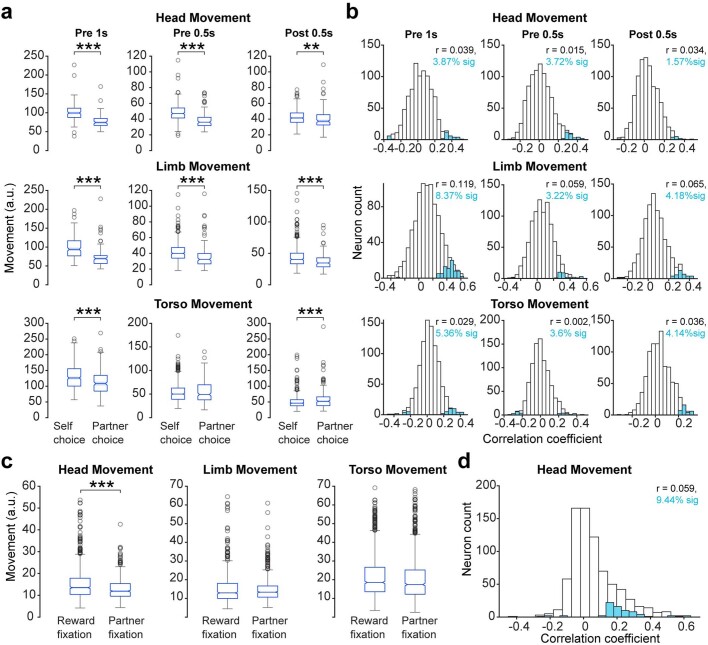
Extended Data Fig. 5. Neural firing rate correlations to movements during pushes and fixations.
a, Self-monkey’s head movement, limb movement, or torso movement occurring around (1000 ms pre, 500 ms pre, or 500 post) self or partner monkey pushes, averaged across six sessions from two monkeys. Head movement: P = 2.07e−19, P = 2.49e−18, P = 0.001; Limb movement: P = 7.12e−18, P = 7.39e−11, P = 2.49e−7; Torso movement: P = 7.01e−9, P = 0.46, P = 0.0007; for Pre 1 s, Pre 0.5 s and Post 0.5 s respectively, Wilcoxon rank-sum test. On each boxplot, the central horizontal mark indicates the median, and the bottom and top edges of the box indicate the 25th and 75th percentiles, respectively. The whiskers extend to the most extreme data points not considered outliers, and the outliers are plotted individually using the ‘o’ symbol. b, Distribution of Pearson correlation coefficients from the correlation of V4 and dlPFC neuron’s firing rates with head movement occurring around (1000 ms pre, 500 ms pre, or 500 post) self and partner pushes. N = 900 neurons from six sessions across two animals. “% sig” represents neurons with a significant correlation coefficient, P < 0.01. c, Self-monkey’s head movement occurring 200 ms after onset of fixations on reward and partner monkey, averaged across six sessions from two monkeys. Head movement: P = 2.44e−9; Limb movement: P = 0.29; Torso movement: P = 0.0009; Wilcoxon rank-sum test. While there is a significant difference in torso movement across reward and partner fixations, the magnitude of the difference is <2%. d, The distribution of Pearson correlation coefficients from the correlation of V4 and dlPFC neuron’s firing rates with head movement occurring 200 ms after fixations on the reward system and partner monkey. N = 900 neurons from six sessions across two animals. “% sig” represents the % neurons with a significant correlation coefficient, P < 0.01. *P < 0.05, **P < 0.01, ***P < 0.001.

