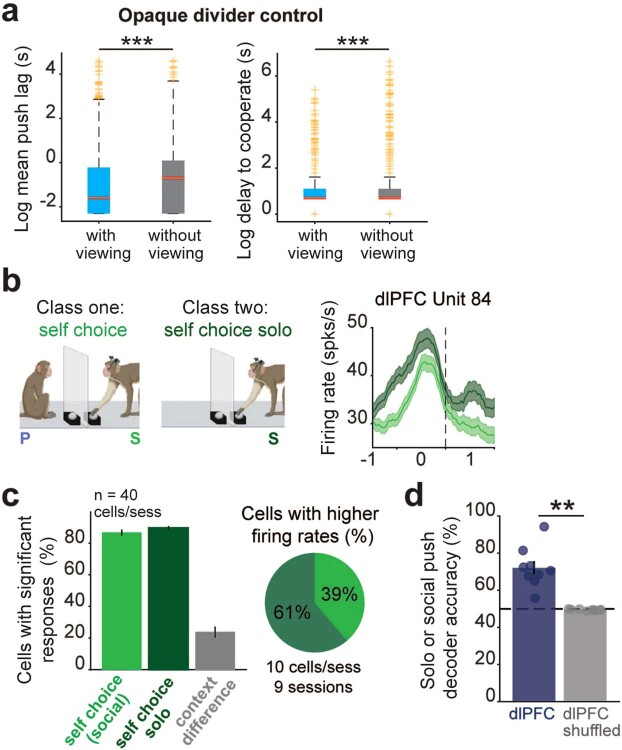
Extended Data Fig. 6. Non-social controls.
a, Left – Log of the average amount of time between self and partner monkey presses during learning (‘with viewing’) sessions and control sessions with the opaque divider (‘without viewing’). P = 2.30e-08, Wilcoxon rank sum test. Right – Log of the average delay to cooperate, or time for both monkeys to be pressing from the start of a trial, during learning sessions and control sessions with the opaque divider. P = 1.078e-04, Wilcoxon rank sum test. Times were pooled across sessions (n = 4 sessions for each condition) and averaged across monkeys. On each boxplot, the central red mark indicates the median, and the bottom and top edges of the box indicate the 25th and 75th percentiles, respectively. The whiskers extend to the most extreme data points not considered outliers, and the outliers are plotted individually using the ‘+’ symbol in gold. b, Social and solo trial schematic with a peri-event time histogram for a dlPFC cell that exhibits a significant change in firing rate between solo and social conditions, Wilcoxon rank-sum test, P < 0.05. c, Mean percentage of cells (n = 40 cells/session from 9 sessions) responding significantly to self-choice in each condition when compared to baseline and compared across conditions (context difference), P < 0.01 Wilcoxon signed-rank test with FDR correction and Wilcoxon rank-sum test for context difference. Pie chart: Session averaged percentage of modulated (context difference) cells that exhibit significantly higher firing rates before self-choice during solo or social condition. d, Actual and shuffled decoding performance for solo and social trials using dlPFC activity occurring 1000 ms before self-choice, averaged across session values plotted as circles. P = 0.004, Wilcoxon signed-rank test. Dashed line represents chance. SEM is represented with error bars. *P < 0.05, **P < 0.01, ***P < 0.001. Illustrations in b were created using Biorender.

