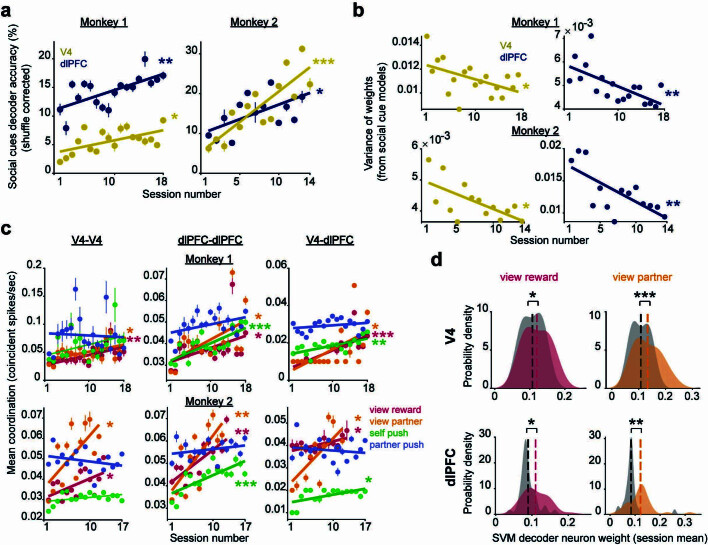
Extended Data Fig. 7. Neural correlates of learning cooperation from stable units only.
a, For each monkey, decoding accuracy for social cues from stable neural population activity in each brain area significantly improves during learning, as seen in Fig. 4a. V4 P = 0.01 and 1.32e−4, PFC P = 0.002 and 0.01; monkeys 1 and 2, linear regression. b, For each monkey, the variance of weights from the decoding models shown in panel ‘a’ significantly decreases across sessions during learning, as observed in Fig. 4g. V4 P = 0.03 and 0.01; PFC P = 0.004 and 0.005; monkey 1 and 2, linear regression. c, For each monkey, mean coordination of stable unit pairs for each social event in V4, dlPFC, and between brain areas is plotted across sessions. The same learning trends are observed as those shown in Fig. 5b, c and Extended Data Fig. 10a. Monkey 1 P-values: P = 0.007, 0.02, 0.09, 0.79; P = 0.03, 0.01, 1.93e−4, 0.07; P = 2.9e−4, 0.02, 0.002, 0.29; Monkey 2 P-values: P = 0.03, 0.01, 0.11, 0.26; P = 0.003, 0.006, 4.98e−4, 0.25; P = 0.03, 0.01, 0.01, 0.56; within V4, within PFC, and between areas respectively, linear regression. d, Probability density plots of decoder weights from stable, V4 and dlPFC correlated neurons during viewing social cues. Weights were averaged across neurons within each session for each monkey, then combined. Results are equivalent to those in Fig. 5e. V4 from left to right: P = 0.011 and P = 2.8e−4; PFC from left to right: P = 0.01 and 0.001, Wilcoxon signed-rank test comparing correlated neuron weights to remaining population. *P < 0.05, **P < 0.01, ***P < 0.001.

