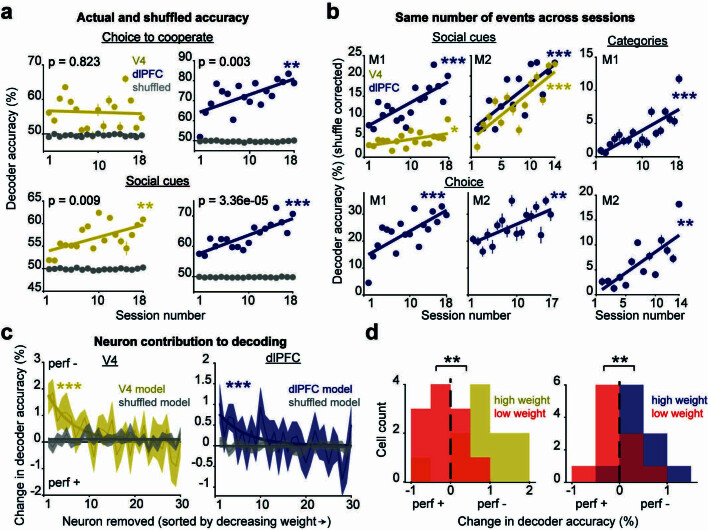
Extended Data Fig. 8. Decoding performance for social events.
a, Actual and shuffled decoding performance for each animal’s choice to cooperate and discrimination of social cues. Actual and shuffled values are plotted to provide an example comparison for the shuffle-corrected plots completed for monkey 1, Fig. 4a and d. Shuffled decoder accuracies remained at chance levels (50%) across all sessions. This was also the case for every other decoding analyses in Fig. 4. b, Decoding performance for social cues, categories, and choice where the number of observations remained the same across all sessions and for each class. For each brain area, decoding accuracy still significantly improves during learning when the number of observations remains unchanged across sessions. All P-values are from linear regression and r is Pearson correlation coefficient. Social cues M1 dlPFC P = 0.0003, r = 0.75 and V4 P = 0.02, r = 0.53; M2 dlPFC P = 9.9e−4, r = 0.78 and V4 P = 0.0003, r = 0.83. Categories M1 dlPFC P = 1.3e-4, r = 0.78; M2 dlPFC P = 0.002, r = 0.76. Choice M1 dlPFC P = 6.84e-4, r = 0.72; M2 dlPFC P = 0.003, r = 0.68. c, The change in decoding performance for social cues (original model accuracy with all neurons minus model with n-1 accuracy), is sorted according to the descending weight of the removed neuron. X-axis represents the index of a neuron; only one neuron was removed from each model. Session-averaged change in accuracy is plotted. Removing neurons with high weights decreases performance but the effect is attenuated as neurons with lower weights are removed. The change in accuracy for the first 30 neurons (out of 104 total in V4, 102 total in dlPFC) of descending weights is shown for clarity. V4 P = 1.11e-5, r = −0.71 and dlPFC P = 0.0009, r = −0.57; linear regression and Pearson correlation. d, For V4 and dlPFC, histograms display the change in decoding accuracy from removing upper and lower deciles of neurons (11 neurons) with the highest (gold and blue) and lowest (red) weights, respectively. Informative and uninformative neurons have significantly different effects on model performance. V4 P = 0.005 and dlPFC P = 0.009, Wilcoxon rank-sum test. *P < 0.05, **P < 0.01, ***P < 0.001.

