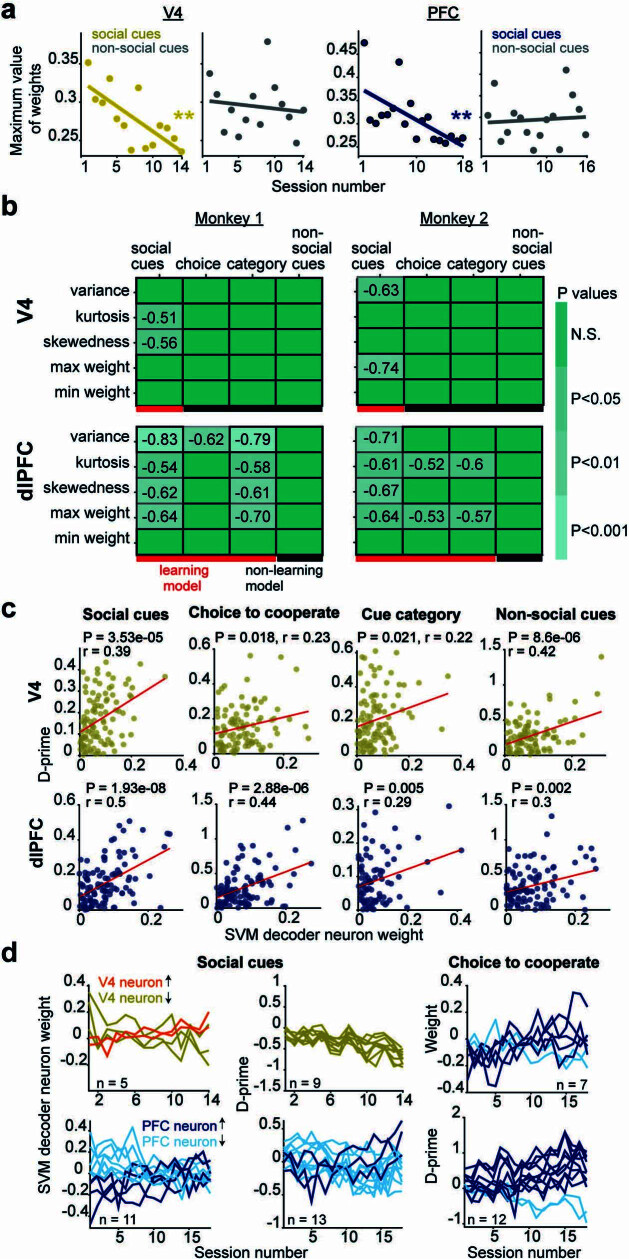
Extended Data Fig. 9. Learning reduces variance of neural population decoding weights.
a, The maximum absolute valued weight for each session in SVM models that decode social or non-social cues is plotted for each cortical area. V4 social cues maximum weight, P = 0.002, r = −0.74; non-social cues P = 0.65, r = −0.12; PFC social cues maximum weight, P = 0.004, r = −0.64; non-social cues P = 0.77, r = 0.07, linear regression and Pearson correlation. b, Summary of decoding models that exhibit decreased variance, kurtosis, skewedness, or maximum weight values for each brain area and monkey. For each decoding model, the P value, represented in shades of teal color, reflects linear regression of each weight metric with session number, as shown in panel a and Fig. 4g. Significantly decreased variance, kurtosis, skewedness, or maximum weight value is only observed in decoding models that exhibit increased decoding performance during learning. V4 P-values for monkey 1 kurtosis and skewedness P = 0.02 and P = 0.01, respectively. V4 P-values for monkey 2 variance and maximum weight P = 0.01 and 0.002, respectively. PFC P-values for monkey 1 variance, kurtosis, skewedness, and maximum weight values from social cues model are P = 1.67e−5, P = 0.03, P = 0.006, P = 0.004, respectively; from choice model variance P = 0.005; from category model variance, kurtosis, skewedness, and maximum weight, P = 9.19e−5, P = 0.01, P = 0.006, P = 0.001, respectively. PFC P-values for monkey 2 variance, kurtosis, skewedness, and maximum weight values from social cues model are P = 0.004, P = 0.02, P = 0.008, P = 0.01, respectively; from choice model kurtosis and maximum weight, P = 0.02 and P = 0.03; from category model kurtosis, and maximum weight, P = 0.02 and P = 0.03, respectively. c, Within a session, neurons’ decoding weight and D-prime values for task variables are positively correlated. Example sessions are shown for various decoding models where accuracy is above chance. Each circle represents the absolute value of D-prime and normalized SVM decoding weight of each neuron within a session. P-values and significant Pearson correlation coefficients are shown. d, For each cortical area, examples of individual neuron normalized weights and D-prime values that significantly increased (dark shade) or decreased (light shade) across sessions. N represents the total number of neurons that exhibited changes. In dlPFC, 75 stable neurons were recorded/session and in V4, 87 stable neurons were recorded/session. *P < 0.05, **P < 0.01, ***P < 0.001.

