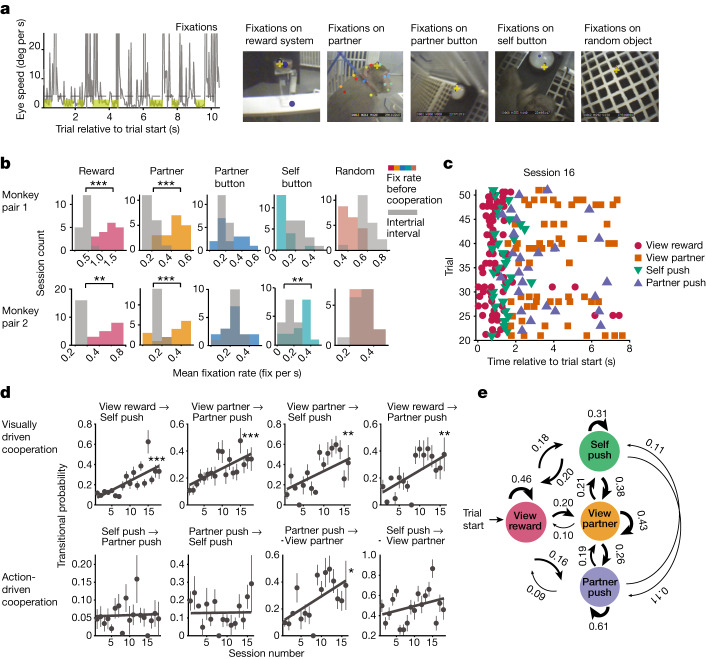
Fig. 2. Interactions between action and viewing while learning to cooperate.
a, Identifying fixations on various objects. Left, during fixations (highlighted in yellow), eye speed remained below threshold (dashed line) for at least 100 ms. Right, scene camera images of objects the animal viewed, labelled with DeepLabCut (coloured dots). The yellow cross represents self-monkey’s point of gaze. b, Histograms of session mean fixation rates for each object computed during the trial (before cooperation) and intertrial interval. Asterisks represent significance of Wilcoxon signed-rank test only where fixations rates were higher during cooperation compared to intertrial period. Pair 1: P = 0.0002, 0.0002, 0.13, 0.002 and 0.0002; pair 2: P = 0.005, 0.0004, 0.95, 0.001 and 0.7 for fixation rates on objects listed left to right. c, Sequence of action and viewing events occurring during cooperation across a random subset of trials in a session. d, Markov model transitional probabilities for example event pairs that begin with a viewing (top row) or action event (bottom row). Top row: P = 0.0008, P = 0.0008, P = 0.003, P = 0.003 and all r = 0.7; bottom row: P = 0.84, 0.9, 0.01 and 0.2; r = 0.6 (‘partner-push’ to ‘view partner’); from left to right, linear regression and Pearson correlation. Two plots on each row came from each monkey pair. Mean transitional probability with s.e.m. is plotted. For complete transitional probability matrices for each monkey, see Extended Data Fig. 2. e, Hidden Markov model transitional probabilities averaged across both monkey pairs for all event pairs. *P < 0.05, **P < 0.01, ***P < 0.001.

