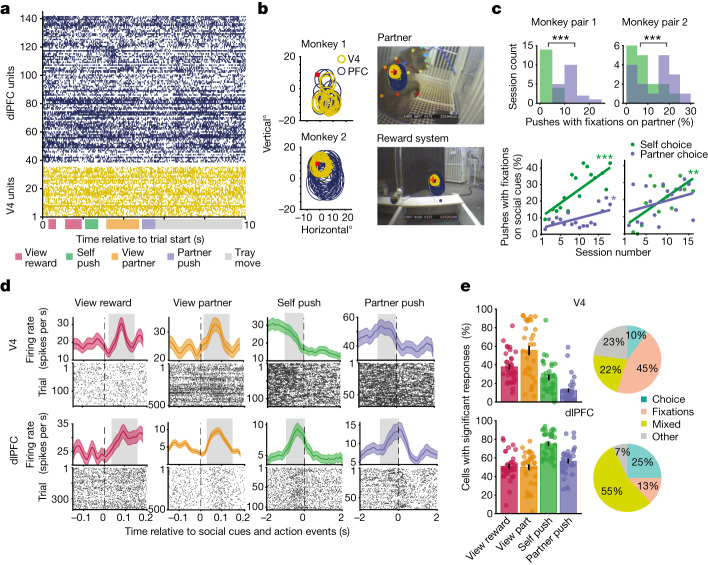
Fig. 3. V4 and dlPFC cell responses to social events.
a, Raster plot of spiking activity from M1’s V4 units 1–35 and dlPFC units 36–140 during one trial. b, Social cues within neurons’ receptive fields. Left, overlapping receptive fields of V4 and dlPFC neurons. V4 receptive field sizes, 4–6°; dlPFC receptive field sizes, 6–13°. The red square represents the point of fixation. Right, scene camera images measuring 35 × 28° (length × height), for which social cues were within receptive fields during fixation. c, Self- and partner-choice to cooperate. Top, percentage of pushes for which fixations on the partner occurred within 1,000 ms of choice in each session. Pair 1, P = 1.91 × 10⁻⁴; pair 2, P = 2.44 × 10⁻⁴; Wilcoxon signed-rank test. Bottom, percentage of pushes for which fixations on the partner and/or reward system occurred within 1,000 ms of choice in each session. Pair 1, P = 0.0004, r = 0.7 and P = 0.03, r = 0.5; pair 2, P = 0.002, r = 0.7 and P = 0.2, r = 0.3; self and partner-choice, respectively; linear regression and Pearson correlation. d, Peri-event time histogram and raster examples of four distinct V4 and dlPFC cells responding to each social event. Dashed lines represent event onset, and the grey shaded box represents the response period used in analyses. e, Significant responses. Left, percentage of cells of the total recorded (M1, 34 V4 cells and 102 dlPFC cells; M2, 104 V4 cells and 46 dlPFC cells) that exhibited a significant change in firing rate from baseline (intertrial period) during social events, averaged across sessions and monkeys. For each cell, P < 0.01, Wilcoxon signed-rank test with FDR correction. Right, percentage of neurons of the total recorded that responded only to choice (self and/or partner), only to fixations (reward and/or partner), both fixations and choice (‘mixed’) or none at all (‘other’). *P < 0.05, **P < 0.01, ***P < 0.001.

