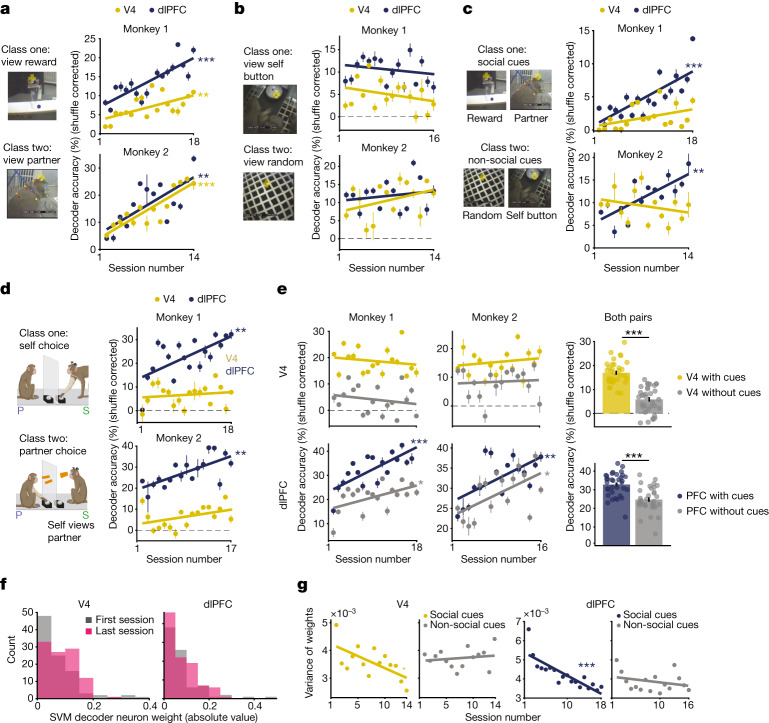
Fig. 4. Population encoding of social events.
a, Decoding accuracy for fixations on reward system and partner-monkey. Chance is 50%, or 0% shuffle-corrected (dashed lines). Plots display shuffle-corrected mean prediction accuracy on test observations (±s.e.m.). M1, P = 0.006, r = 0.6 and 2.31 × 10⁻⁵, r = 0.8; M2, P = 3.01 × 10⁻⁵, r = 0.9 and P = 0.004, r = 0.7, V4 and dlPFC, respectively. All P values in a–e and g are from linear regression; r is Pearson correlation coefficient. b, Decoding performance for fixations on two non-social objects. M1, P = 0.26 and 0.41; M2, P = 0.18 and 0.52, V4 and dlPFC, respectively. c, Decoding performance for object categories: fixations on social and non-social cues. M1, P = 0.08 and P = 0.0001, r = 0.8; M2, P = 0.3 and P = 0.001, r = 0.8, V4 and dlPFC, respectively. d, Decoding performance for each animal’s choice to cooperate. M1, P = 0.54 and P = 0.003, r = 0.7; M2, P = 0.1 and P = 0.002, r = 0.7, V4 and dlPFC, respectively. e, Viewing social cues improves choice encoding. Left, Decoding performance for each animal’s choice using pushes with preceding fixations on either social cue within 1,000 ms of push (navy and gold) compared to pushes without fixations on social cues (grey). V4 M1, P = 0.48 and P = 0.4; M2, P = 0.49 and P = 0.71. dlPFC M1, P = 0.0002, r = 0.8 and P = 0.02, r = 0.5; M2, P = 0.008, r = 0.6 and P = 0.02, r = 0.6; with and without social cues, respectively. Right, decoding accuracy for choice averaged across both monkeys for each condition. V4 P = 7.44 × 10⁻⁷ and dlPFC P = 3.46 × 10⁻⁶; Wilcoxon signed-rank test. f, Distribution of absolute valued neurons’ weights from the SVM model for decoding social cues (V4, 98 and 102 neurons; dlPFC, 82 and 101 neurons in first and last session). g, Variance of weight distributions for each session from SVM models decoding social and non-social cues, as seen in a,b. V4 data are M2 (average 104 cells per session), and PFC data are M1 (average 102 cells per session). V4, P = 0.01, r = −0.63 and P = 0.57; dlPFC, P = 1.67 × 10⁻⁵, r = −0.83 and P = 0.29; social and non-social cue models, respectively. *P < 0.05, **P < 0.01, ***P < 0.001.

