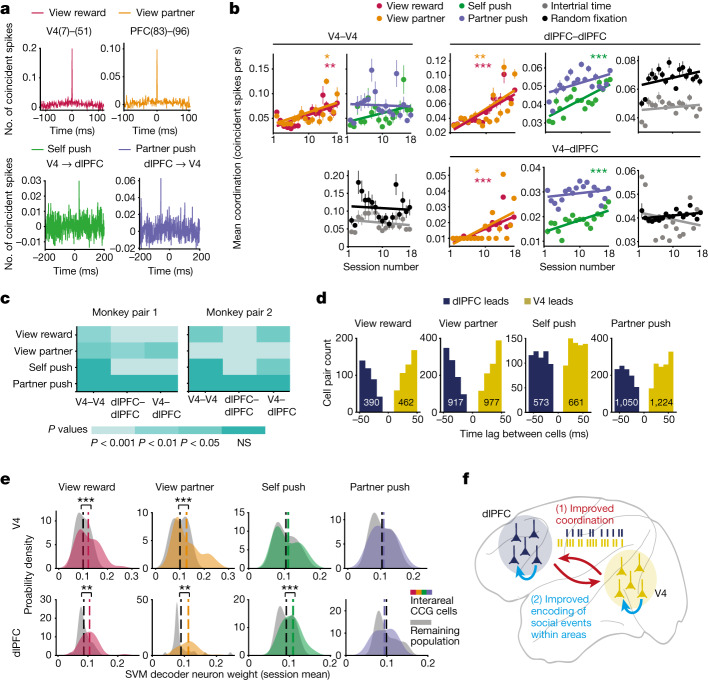
Fig. 5. Spike-timing coordination while learning social interactions.
a, Top, example CCGs of a V4 cell pair and a dlPFC cell pair during two social events, averaged across observations. Bottom, example CCGs of V4–dlPFC cell pairs. b, Temporal coordination for social and non-social events. Top, mean coordination plotted across sessions for each social event in V4, dlPFC and between areas (V4, P = 0.001, r = 0.7; P = 0.01, r = 0.6; P = 0.09 and P = 0.8. dlPFC, P = 5.68 × 10⁻⁶, r = 0.9; P = 0.003, r = 0.7; P = 1.25 × 10⁻⁴, r = 0.7 and P = 0.07. V4–dlPFC, P = 2.89 × 10⁻⁴, r = 0.8; P = 0.01, r = 0.6; P = 9.93 × 10⁻⁴, r = 0.7 and P = 0.27. Linear regression with Pearson’s correlation coefficient). Bottom: mean coordination during fixations on random objects and during random events (intertrial period). V4, P = 0.4 and 0.7; dlPFC, P = 0.4 and 0.09; V4–dlPFC: P = 0.4 and 0.1; random event and fixations, respectively. All data from M1; for M2, see Extended Data Fig. 10a. c, Colour map of within/between area P values from linear regression of mean coordination for each social event in each monkey. Temporal coordination increases during learning. d, Histograms of time-lag values of CCG peaks between all significantly correlated V4–dlPFC cell pairs across sessions and monkeys for each social event. e, Correlated V4–dlPFC neurons contribute more to encoding of social events. Probability density plots of decoder weights of V4 and dlPFC neurons significantly correlated and the remaining uncorrelated population during each social event. Weights were averaged across neurons in each session for each monkey and then combined. V4 from left to right, P = 6.48 × 10⁻⁴, P = 6.38 × 10⁻⁴, P = 0.33, P = 0.24; PFC: P = 0.002, P = 0.001, P = 7.41 × 10⁻⁴, P = 0.14; Wilcoxon signed-rank test. f, Cartoon of social learning model: increased interarea spike-timing coordination improves the encoding of social variables to mediate learning social interaction. NS, not significant.

