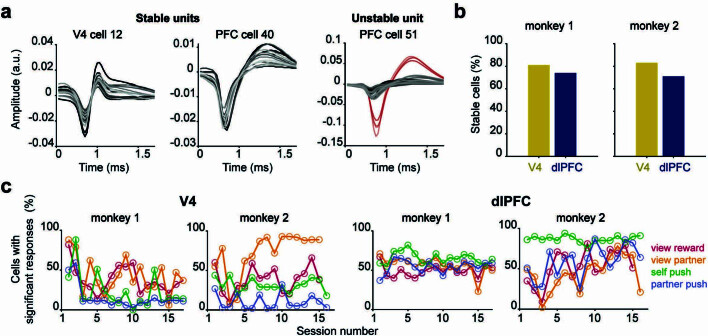
Extended Data Fig. 3. Neural population stability.
a, Example single units from one monkey showing spike waveforms recorded across sessions. Each panel represents the average waveform of the unit from one session, with session 1 plotted in a dark color and increasing in transparency across sessions. The unstable unit shows spike waveforms representing stable MUA (Black) and unstable SUA (red); the single unit was only present for 4 out of the 18 sessions. b, The number of stable cells divided by the total number of cells is the percentage of stable units in each area for each monkey. In monkey 1, 81% of recorded units (504/620) in V4 and 74% of recorded units in dlPFC (1350/1837) were consistent across sessions. In monkey 2, 83% of recorded units in V4 (1479/1773) and 71% of recorded units in dlPFC (561/794) were consistent. c, For each brain region, the percentage of cells out of the total recorded (M1: 34 V4 cells, 102 dlPFC cells; M2: 104 V4 cells, 46 dlPFC cells) that exhibited a statistically significant change in firing rate from baseline (intertrial interval firing rate) during social events (as shown in Fig. 3e but plotted across sessions for each monkey). For each cell, P < 0.01 Wilcoxon signed-rank test with FDR correction. The percentage of responding cells does not systematically change across sessions.

