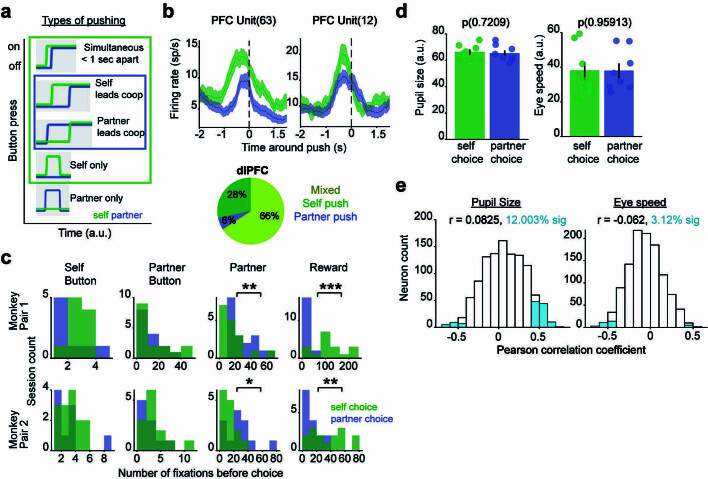
Extended Data Fig. 4. Neural responses and oculomotor events during pushes.
a, Self and partner pushes consist of push types that occurred in their respective outlined boxes. ‘Partner only’ pushes rarely occurred and were not used in analysis. For total number of pushes, see Methods: Firing Rate and Response. b, PSTHs from two example dlPFC units that show an increase in firing rate before self-monkey and partner pushes. Bottom: pie chart reflecting the percentage of push-modulated dlPFC units that respond only to self-push, only to partner push, or to both (“mixed”). Percentages averaged across sessions and monkeys. M1: 102 total dlPFC cells, 73 are push responsive; M2: 46 total dlPFC cells, 41 are push responsive. c, The distribution of the number fixations on each object that occurred before (1000 ms pre) self and partner (1000 ms pre, 500 ms post) pushes in each session. Self-monkey views the partner more during partner pushes compared to self-pushes, but he viewed the reward more before self-pushes. Pair 1 P Values: 0.005 and 5.79e−5, Pair 2 P values: 0.03 and 0.003, Wilcoxon rank-sum test. d, Pupil size and eye speed, averaged across sessions and animals, that occurred before (1000 ms pre) the self and partner monkey pushes. There is no significant difference in pupil size and eye speed between animal’s choices, Wilcoxon rank-sum test, P > 0.05. e, The distribution of Pearson correlation coefficients from the correlation of V4 and dlPFC neuron’s firing rates with pupil size and eye speed occurring before (1000 ms pre) self and partner pushes. N = 1157 neurons from eight sessions across two animals. Percent significant represents neurons with a significant correlation coefficient, P < 0.01. *P < 0.05, **P < 0.01, ***P < 0.001.

