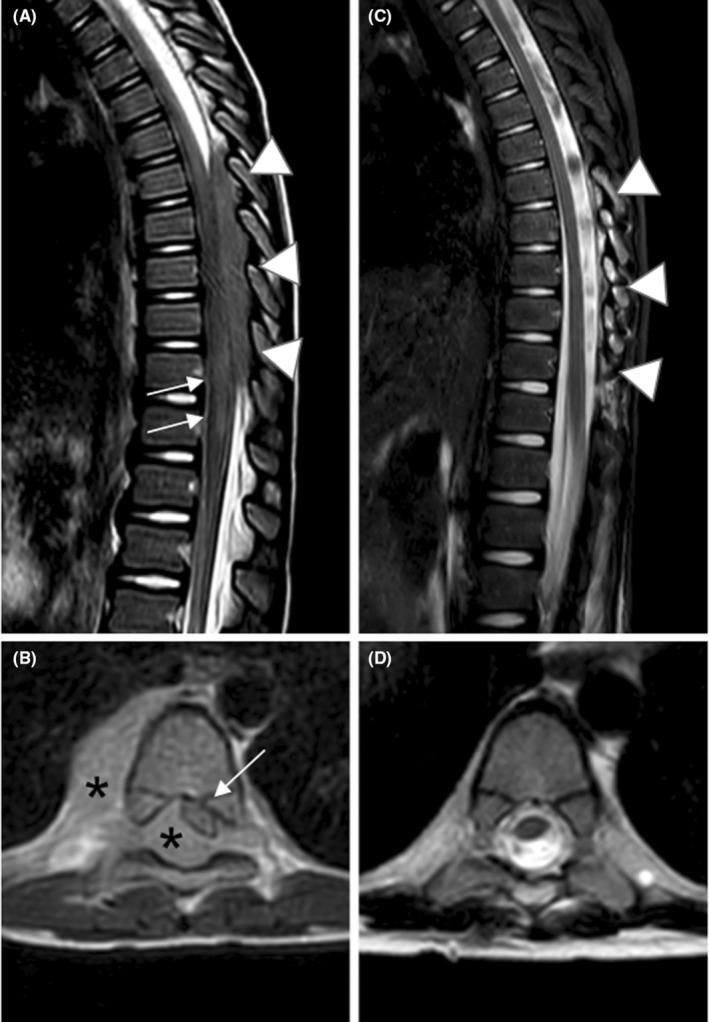
FIGURE 1.

Sagittal (A) and axial (B) T2‐weighted images. Pre‐operative scan reveals epidural tissue (arrowheads in A and asterisks in B), located within the spinal canal, from D7 to D11, slightly hyperintense to the spinal cord. The lesion compresses and dislocates the dural sac antero‐laterally, towards the left (white arrow in B), and it extends through the right conjugation foramen, into the adjacent cost‐vertebral space (asterisk in B). An area of spinal cord signal abnormality is seen at D11‐D12 (arrows in A). Sagittal STIR (C) and axial (D) T2 weighted images. Post‐operative scan shows surgical removal of the neoplastic intracanal component, with complete resolution of the mass effect (arrowheads in C) as well as the spinal cord signal abnormality described. The component seen in the right right costovertebral space showed a prompt response to chemotherapy.
