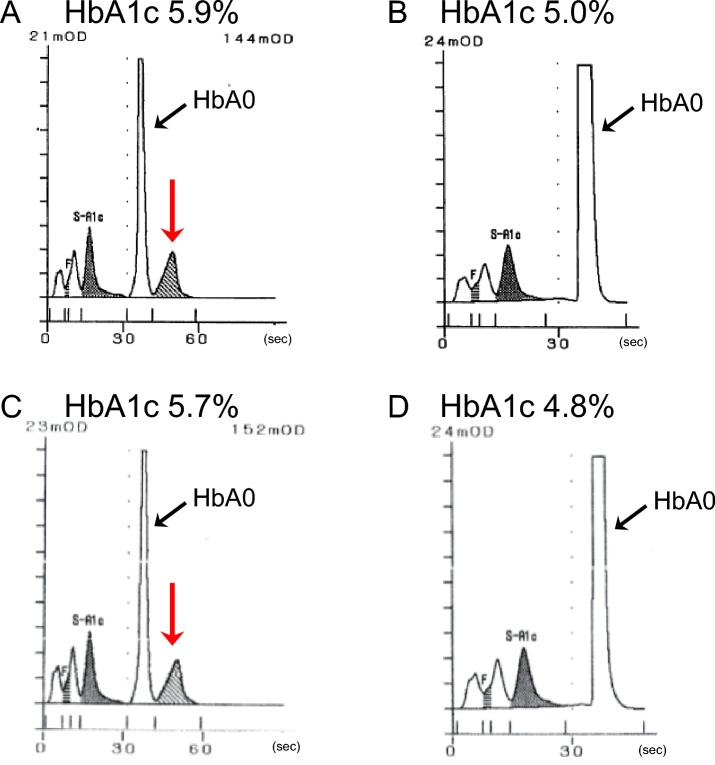
Fig. 1.
HPLC chromatograms of two patients with Hb Q-Iran. HPLC chromatograms of patient 1 (A, B) and patient 2 (C, D) are shown. Chromatograms measured by VM (A, C) and FM (B, D) of HA-8180V are shown. In A and C, abnormal peaks indicated by red arrows, which eluted later than HbA0, are observed. VM variant mode, FM fast mode

