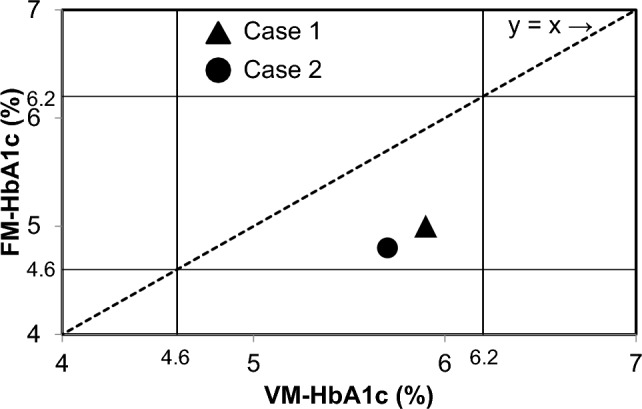
Fig. 3.

Relationship between VM–HbA1c and FM–HbA1c in two patients with Hb Q-Iran. VM–HbA1c (x-axis) and FM–HbA1c (y-axis) of two patients with Hb Q-Iran are plotted. The reference ranges of HbA1c (4.6–6.2%) are indicated by the solid line, and the straight line of y = x is indicated by the dotted line. VM variant mode, FM fast mode
