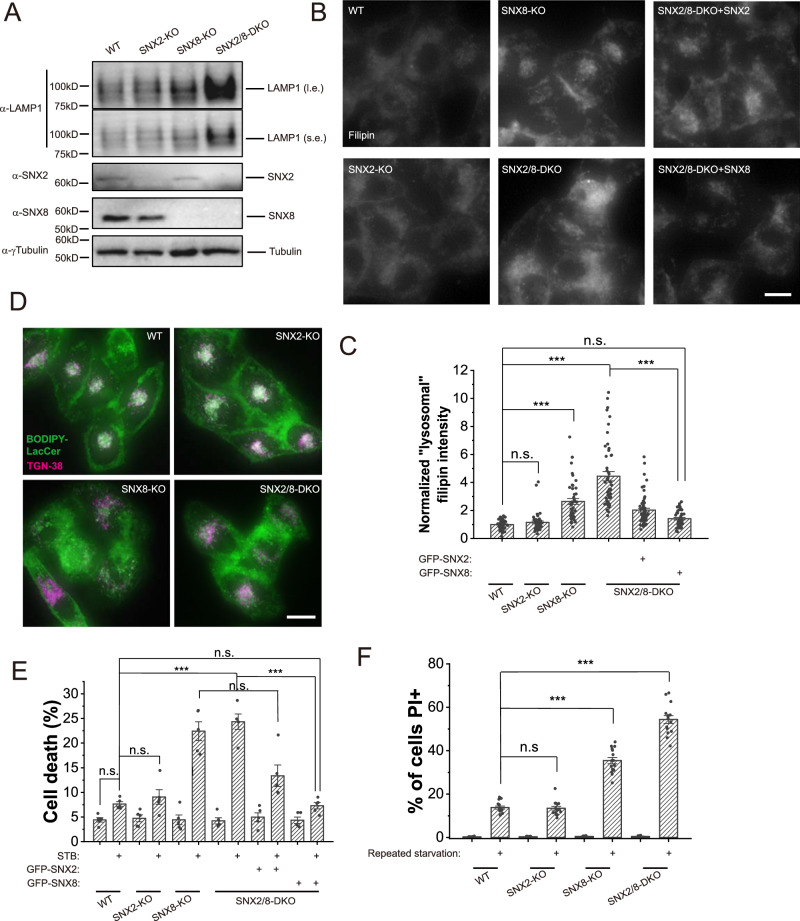
Fig. 3. SNX8-KO and SNX2/8-DKO cells show LSD-like phenotypes.
A Total LAMP1 levels in WT, SNX2-KO, SNX8 KO and SNX2/8-DKO HeLa cells were assessed with Western blots. B Representative images of HeLa cell lines as indicated fixed and stained with filipin to visualize free cholesterol in cells. Scale bar = 10 μm. C Quantification of intracellular filipin intensity (considered as “lysosomal” as it co-localized well with lysosomal marker LAMP117 for sample groups shown in (B) (n = 53, 48, 46, 50, 61, 44, respectively, for each group, p = 1 (WT vs. SNX2-KO), <0.00001 (WT vs. SNX8-KO), <0.00001 (WT vs. SNX2/8-DKO), 0.71 (WT vs. SNX2/8-DKO + GFP-SNX8), 0 (SNX2/8-DKO vs. SNX2/8-DKO + GFP-SNX8)). D Representative images of HeLa cell lines (as indicated) stably expressing TGN38 and loaded with BODIPY-LacCer, chased for 1 h. Scale bar = 10 μm. E HeLa cell lines (as indicated) were treated with STB buffer for 6 h to induce cell death, which was assayed by LDH release assay (n = 5 for all groups, p = 0.72 (WT Ctrl vs. WT STB), 1 (WT STB vs. SNX2-KO STB), <0.00001 (WT STB vs. SNX8-KO STB), <0.00001 (WT STB vs. SNX2/8-DKO STB), 0.00098 (WT STB vs. SNX2/8-DKO + GFP-SNX2), 1 (WT STB vs. SNX2/8-DKO + GFP-SNX8), 1 (SNX8-KO STB vs. SNX2/8-DKO STB), 0.094 (SNX8-KO STB vs. SNX2/8-DKO + GFP-SNX2 STB), <0.00001 (SNX2/8-DKO STB vs. SNX2/8-DKO + GFP-SNX8 STB)). F HeLa cell lines (as indicated) were subject to a repeated serum starvation protocol with Glu-free DMEM (12 h starvation followed by 12 h complete medium, repeated 3 times). Cells were then stained with PI to visualize dead cells (n = 15 fields for all groups, p = 1 (WT stv vs. SNX2-KO stv), 0 (WT stv vs. SNX8-KO stv), 0 (WT stv vs. SNX2/8-DKO stv)). For graphs, error bars are s.e.m, statistical comparison was done using one-way ANOVA, Tukey test (two sided, no adjustments). Source data are provided as a Source Data file.

