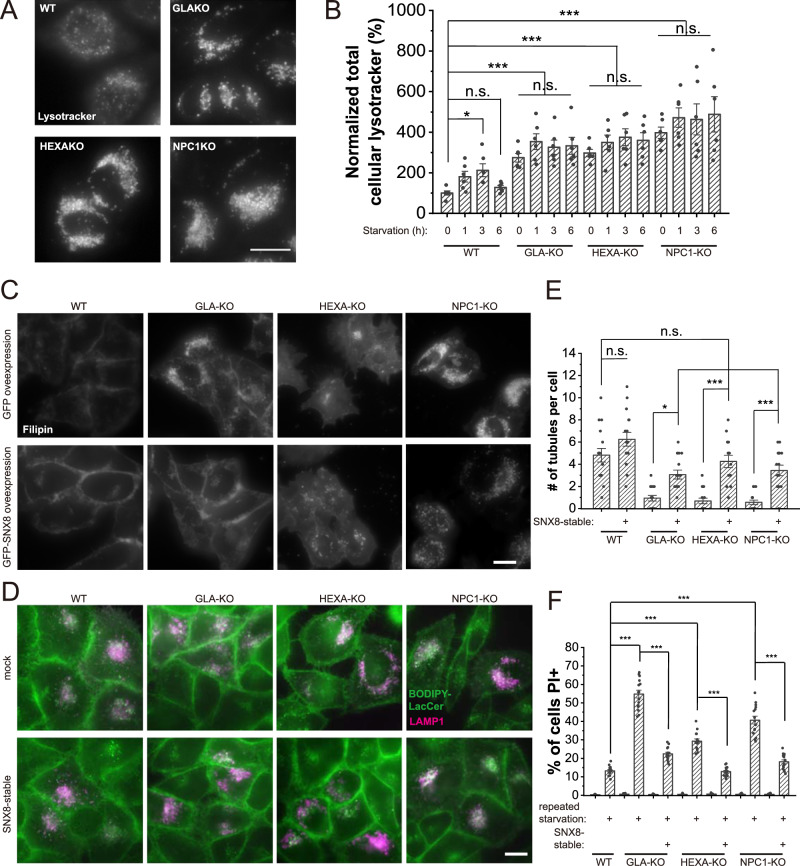
Fig. 4. SNX8 Overexpression rescues LSD phenotypes in LSD model cells.
A Representative images of WT, GLA-KO, HEXA-KO, and NPC1-KO HeLa cells loaded with lysotracker to visualize lysosomes. Lysotracker positive puncta were enlarged in three KO cell lines. Scale bar = 10 μm. B HeLa cell lines (as labeled) were left untreated or treated with serum starvation for the indicated time and stained with lysotracker. The total lysotracker represents total lysosome volumes in cells (n = 6 for all groups, p = 0.044 (WT 0 h vs. WT 3 h), 1 (WT 0 h vs. WT 6 h), <0.00001 (WT 0 h vs. all LSD groups), 0.50 (GLA-KO 0 h vs. GLA-KO 1 h), >0.9 (GLA-KO 0 h vs. GLA-KO 3 h&6 h), 0.96 (HEXA-KO 0 h vs. HEXA-KO 1 h), 0.52 (HEXA-KO 0 h vs. HEXA-KO 3 h), 0.85 (HEXA-KO 0 h vs. HEXA-KO 6 h), 0.62 (NPC1-KO 0 h vs. NPC1-KO 1 h), 0.80 (NPC1-KO 0 h vs. NPC1-KO 3 h), 0.26 (NPC1-KO 0 h vs. NPC1-KO 6 h)). C WT, GLA-KO, HEXA-KO, and NPC1-KO HeLa cells stably expressing GFP or FLAG-SNX8 were fixed and stained with filipin to visualize free cholesterol. Blue channel (filipin) was shown in the images. Scale bar = 10 μm. D WT, GLA-KO, HEXA-KO, and NPC1-KO HeLa cells with or without stably-expressed SNX8 were transfected with LAMP1-mCherry for 24 h, then loaded with BODIPY-LacCer, chased for 1 h and imaged. Scale bar = 10 μm. E WT, GLA-KO, HEXA-KO, and NPC1-KO HeLa cells with stably-expressed SNX8 were transfected with LAMP1-mCherry for 24 h and then serum-starved for 16 h before being subjected to a 1 min live imaging. The number of tubules within the 1 min period was quantified (n = 16 for all groups, p = 0.33 (WT ctrl vs. WT + SNX8), 0.12 (WT ctrl vs. GLA-KO + SNX8), 0.99 (WT ctrl vs. HEXA-KO + SNX8), 0.39 (WT ctrl vs. NPC1-KO + SNX8), 0.026 (GLA-KO ctrl vs. GLA-KO + SNX8), <0.00001 (HEXA-KO ctrl vs. HEXA-KO + SX8, 0.00043 (NPC1-KO ctrl vs. NPNC1-KO + SNX8)). F WT, GLA-KO, HEXA-KO, and NPC1-KO HeLa cells with stably-expressed SNX8 were treated with a repeated starvation protocol as in (Fig. 3F). Cells were then stained with PI to visualize dead cells (n = 15 fields for all groups, p = 0 for all comparison pairs shown). For graphs, error bars are s.e.m, statistical comparison was done using one-way ANOVA, Tukey test (two sided, no adjustments). Source data are provided as a Source Data file.

