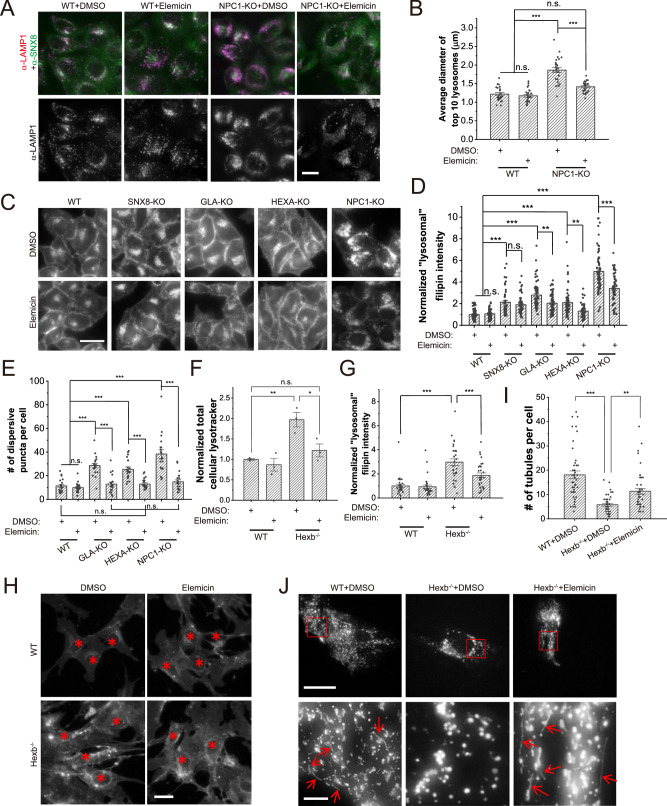
Fig. 6. Elemicin suppresses LSD phenotypes in LSD model cells and Hexb−/− mouse fibroblasts.
A, B WT and NPC1-KO HeLa cells were treated with DMSO or Elemicin (10 μM) for 24 h, and then immunostained with anti-LAMP1 and anti-SNX8 antibodies. Diameters of large lysosomes visualized by LAMP1 were measured and compared. Representative images are shown in (A), and quantifications are shown in (B) (n = 25 for all groups, p = 0.89 (WT + DMSO vs. WT+Elemicin), 0.15 (WT + DMSO vs. NPC1-KO+Elemicin), and 0 for the other two comparisons). Note that in NPC1-KO cells, Elemicin also appeared to enhance the recruitment of SNX8 onto lysosomes. Scale bar = 20 μm. C, D Sample groups same as in (A) and (B) were stained with filipin to visualize free cholesterol. Representative images are shown in (C) and quantifications are shown in (D) (n = 58 for SNX8-KO cells and 64 for all other groups, p > 0.9 for WT + DMSO vs. WT+Elemicin and SNX8-KO + DMSO vs. SNX8-KO+Elemicin, <0.00001 for WT + DMSO vs. SNX8-KO + DMSO/GLA-KO + DMSO/HEXA-KO + DMSO/NPC1-KO + DMSO, 0.0044 (GLA-KO + DMSO vs. GLA-KO+Elemicin), 0.0021 (HEXA-KO + DMSO vs. HEXA-KO+Elemicin), <0.00001 (NPC1-KO + DMSO vs. NPC1-KO+Elemicin)). Scale bar = 20 μm. E WT, GLA-KO, HEXA-KO, and NPC1-KO HeLa cells were treated with DMSO or Elemicin (20 μM) for 24 h, then loaded with BODIPY-LacCer and chased for 1 h before imaging. Cells were then quantified with the number of dispersive BODIPY puncta. (n = 20 for all groups, p > 0.9 for all comparisons marked with n.s., =0.00002 for WT + DMSO vs. HEXA-KO+Elemicin, =0.00025 for HEXA-KO + DMSO vs. HEXA-KO+Elemicin, and <0.00001 for all other comparisons). F WT or Hexb−/− primary fibroblasts isolated from P1 neonatal mice were treated with DMSO or Elemicin (20 μM) for 24 h, stained with lysotracker, and total cellular lysotracker fluorescence was measured by flow cytometry (n = 3 for all groups, p = 0.0056 (WT + DMSO vs. Hexb−/−+DMSO), 0.71 (WT + DMSO vs. Hexb−/−+Elemicin), 0.023 (Hexb−/−+DMSO vs. Hexb−/−+Elemicin)). G, H Sample groups same as in (F) were stained with filipin to visualize free cholesterol. Representative images with red asterisks indicating cell nuclei are shown in (H) and quantifications are shown in (G) (n = 30 for all groups, p = 0 for WT + DMSO vs. Hexb−/−+DMSO, and =0.00085 for Hexb−/−+DMSO vs. Hexb−/−+Elemicin). Scale bar = 10 μm. I, J WT or Hexb−/− primary fibroblasts isolated from P1 neonatal mice were transfected with LAMP1-mCherry and treated with DMSO or Elemicin (20 μM) for 24 h, serum starved for 16 h, and then imaged for LAMP1. LAMP1-positive tubules were counted (n = 45 for all groups, p = 0 for WT + DMSO vs. Hexb−/−+DMSO, and =0.0056 for Hexb−/−+DMSO vs. Hexb−/−+Elemicin). Representative images showing the whole cell (upper panels) and enlarged insets (lower panels, ROI are marked with red boxes) are shown in (J). Note that the fluorescent intensity was differentially boosted to clarify tubules’ visualization (pointed with red arrows). Scale bar = 20 μm for upper panels and 3 μm for insets. For graphs, error bars are s.e.m, statistical comparison was done using one-way ANOVA, Tukey test (two sided, no adjustments). Source data are provided as a Source Data file.

